![]()
Polar Equations

by
Patty Wagner
In this investigation, we will explore a couple of functions expressed in polar coordinates by considering what we know about the function in order to predict the shape of its graph.
Consider r = a + b cos (kθ)
For simplicity, we will only consider positive integer values for a and b and k > 1.
Let's initially consider the case where a = b = 1. We know the graph of this equation will have a series of points where r = 0. This will happen when 1 + cos (kθ) = 0 which is when cos (kθ) = -1.
Turning our attention to the values of θ for which cos (kθ) = -1, we can say it will occur when
kθ = (2n + 1)π, or more specifically, when θ = (2n + 1)π/k where n = 0,1,2,...
If 0 ≤ θ ≤ 2π, we can see that how often cos (kθ) = -1 depends on the value of k. For example, if k = 6,
cos (6θ) = -1 when θ = π/6, 3π/6 = π/2, 5π/6, 7π/6, 9π/6 = 3π/2, 11π/6 which is six times.
So at six different times in our graph, we will have r equal to zero. Let's store this away for now and turn our attention to maximum values.
r = 1 + cos (kθ) will have maximum values when cos (kθ) = 1 (the maximum possible value for cos (kθ)). At these points, r = 1 + 1 = 2. We know that cos (kθ) = 1 when
kθ = 2nπ, so θ = 2πn/k where n = 0,1,2,...
If 0 ≤ θ ≤ 2π, then we will have maximum values for r (r = 2) at each of these points. In our example above, where k = 6, maximums will occur when
θ = 0, 2π/6 = π/3, 4π/6 = 2π/3, 6π/6 = π, 8π/6 = 4π/3, 10π/6 = 5π/3, 2π which is six times. (note 2π = 0)
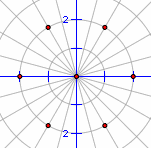
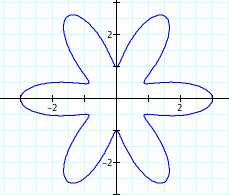
Therefore, we will have a graph with 6 minimum values of zero and 6 maximum values of r = 2 evenly dispersed around the origin, like so:
We know that our points on the circle with radius 2 are the maximum points and between each of these maximums is a zero. Therefore, we know this graph will result in a flower-like graph, with the number of petals equal to k. By plotting a few other points, we can get a rough idea of the petal shape and predict the graph will look something like this:
Going back to our more general case, we saw that the number of maximum and minimum values for the graph of
r = 1 + cos (kθ)
was dependent on the value of k; and furthermore, equals k. Therefore, the graph of
r = a + b cos (kθ), where a = b = 1 and k >1will always generate a flower-like graph with k petals.
Now let's consider the function
r = 1 + sin (kθ)
We can easily predict that this function will yield an identical shape that is rotated 90°/k from that of the previous function, since our maximum and minimum values will reflect the shift in values of θ that produce -1 and 1 in the sine function.
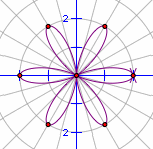
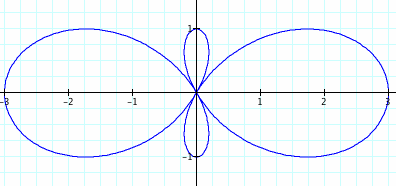
Here is the actual graph of r = 1 + sin (6θ):
Our prediction is correct in that we have a six petal flower-like shape, rotated what appears to be 15° from the x-axis.
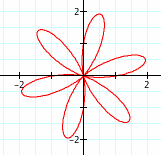
Here is the actual graph of r = 1 + cos (6θ) to verify that our earlier prediction was correct:
Now that we have a general mathematical idea of what is happening with r = 1 + cos (kθ), can we predict what
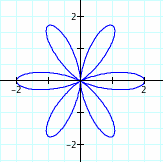
r = 2 + cos (kθ)
will look like? Obviously, since our maximum from cos(kθ) is still 1, our petal size will now be three. But our minimum from cos(kθ) is -1, giving us a minimum of r = 2-1 = 1. So the petals will not "meet" at the origin as in our previous example, but rather, each minimum will fall on the unit circle (r = 1) around the origin.
Here is the graph of r = 2 + cos (kθ) and we can see our prediction is correct.
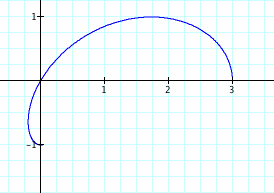
What if r = a + b cos (kθ) and a, b > 1?
We can produce a larger flower whose petals meet at the origin as long as a = b. If a > b, then the minimums will fall on the circle with radius a - b and the maximums will lie on the circle r = a + b.
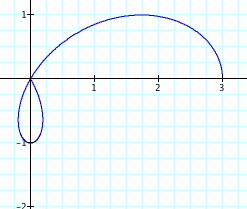
A unique case is created when a < b. With a lttle bit of thought, we realize that the minimum value will be negative. Let's take the simple case of a = 1, b = 2, k = 2 to explore this idea. We saw earlier that the minimum is achieved when
θ = (2n + 1)π/k
so when k = 2, we have a minimum when θ = π/2, 3π/2. When θ = π/2, r = 1-2 = -1. Additionally, we know that r = 0 when cos 2θ = -1/2 which is when θ = π/3. Since 0 < π/3 < π/2, we know that our graph passes through the origin on its way to its minimum of -1.
At this point it will "turn around" and pass through the origin again when θ = 2π/3
So we see that when a < b, we introduce another petal to our k-petaled flower. Our final figure will have 2k petals!
Note that the large petals reflect the maximum, when cos (kθ) = 1, so r = 1 + (2)(1) = 3, and the smaller petals reflect when r is at its minimum, when cos (kθ) = -1, so r = 1 + (2)(-1) = -1.
Is it possible for the petals created by the minimum to be larger than those created by the maximum? If so, then
a + b(1) < a + b(-1)
a + b < a - b
2b < 0
b < 0
This tells us that if a and b are of opposite signs, then the petals created by the minimums will be larger than those created by the maximums. We'll leave it to another time to consider all the other possibilities generated by a,b,k < 1. Now that we've seen the general trend, the procedure for doing so is clear.
Return to Patty Wagner's home page