
Assignment 1 :: Graphs
The
sine wave is a function that can be seen in a variety of areas, including
mathematics, music, physics, and engineering. It's basic form is as follows:
|
|
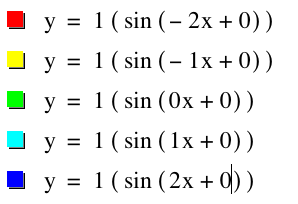
y = a sin (bx + c) Each
of the given variables, as they are modified, have a specific impact to the
resulting sine wave, or graph. These variables are explored in further detail
below. In this exploration, the graph of y
= sin x will be the starting point, from which various transformations
can be discovered. Note that this graph is represented by a = 1, b = 1, and c
= 0. |
Amplitude (a)
The
amplitude of the graph, often denoted as A, represents the maximum distance
from the center of the sine wave. In exploring this variable, 0 may be used for
A. This simplifies the function, eliminating the sine function and resulting in
a function of y = 0.
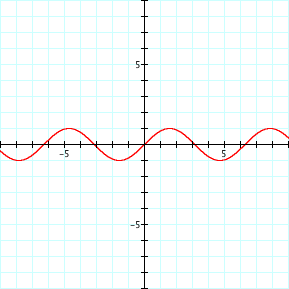
The
base function, y = sin x, has an
altitude of 1. Exploring the definition and graph above, it shows that the
maximum distance from the center of the wave is 1. This can be seen both above
and below the x-axis. Taking this idea and expanding upon it, additional
amplitude values can be explored as displayed in the video below.
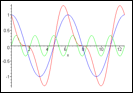
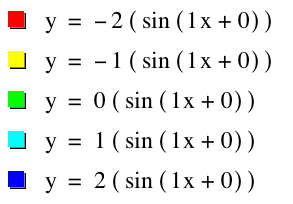
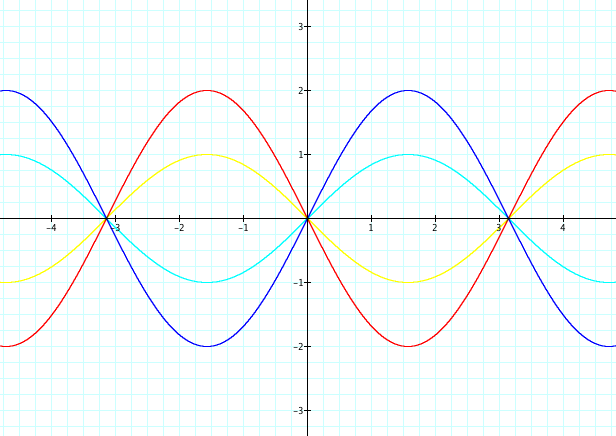
To
take a more focused look at the amplitude, we can explore some specific values.
Below are the graphs representing the standard form with 5 different values:
-2, -1, 0, 1, 2.
|
|
|
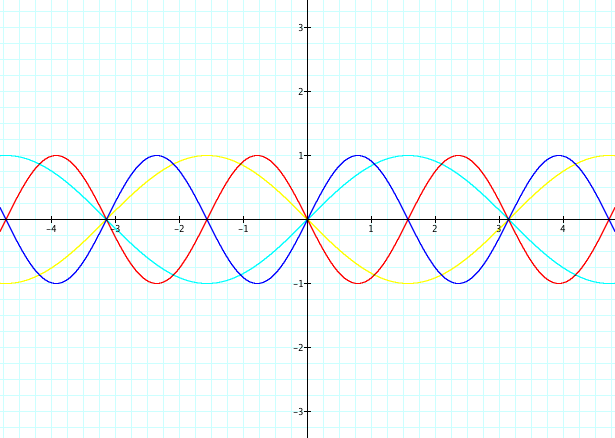
Angular Frequency (b)
The
angular frequency of the graph, often denoted as ω, represents the number
of periods within an interval of length 2π. Notice that as b increases from 0,
it appears to shrink wave without changing the height. On the other hand, as b
approaches 0, the wave appears to stretch.
To
take a more focused look at the angular frequency, we can explore some specific
values. Below are the graphs representing the standard form with 5 different
values: -2, -1, 0, 1, 2. You can again see the conclusions drawn earlier about
the shrinking and stretching of the wave, however, we can also see that +b and
-b are reflective over the x-axis.
|
|
|
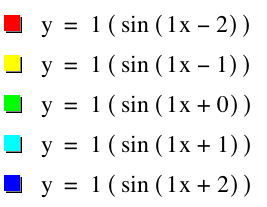
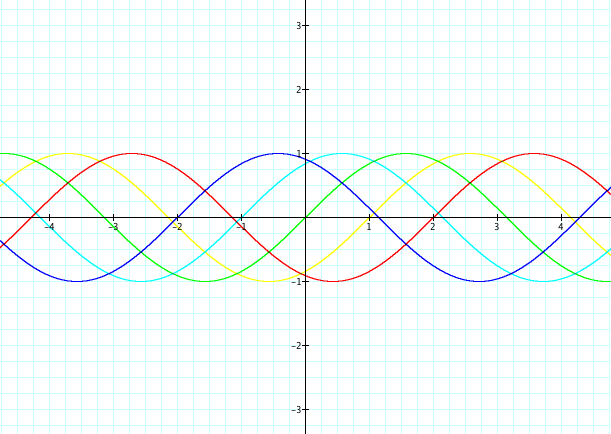
Phase (c)
The
phase of the graph, often denoted as θ, represents the positioning of the
wave. As c increases, the wave transitions down the positive end of the x-axis.
As c decreases, the wave does the opposite and transitions to the negative end
of the x-axis.
To
take a more focused look at the phase, we can explore some specific values.
Below are the graphs representing the standard form with 5 different values:
-2, -1, 0, 1, 2. The exact value of c represents where our original function of
y = sin x is transitioned to on the x-axis. For example, a value of b = 2 moves
the original x-axis intersect at 0 to 2. Likewise, for b = -2, it is
transitioned to -2 on the x-axis.
|
|
|
Further exploration
We can revisit the original
graph to explore the radian values that are relevant to it. Focusing on one
period of the wave, or a length of 2π. This length contains one sine wave,
which is then repeated indefinitely. The wave intersects the x-axis at the
values of -π, 0, and π. The wave continues to intersect the x-axis at every
interval of π (2π, 3π, 4π, etc.).
y = a sin (bx + c) + d
|
|
|
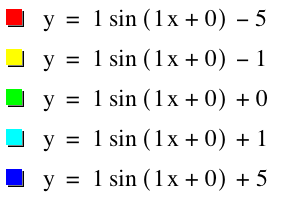
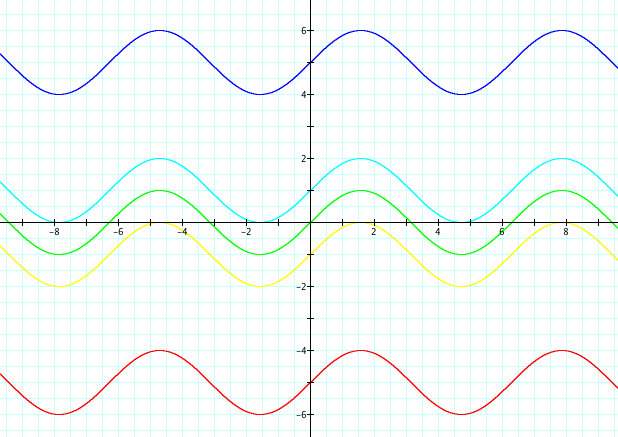
* What effect does the new variable d
have on the graph?
* What is the difference between a
negative and positive value of d?
* Does this variable modify the altitude, angular
frequency, or phase of the graph?
Home | EMAT 6680 | Dr. Jim Wilson