
THE LIMACONS AND OTHER POLAR CURVES
By Dario Gonzalez Martinez
This exploration consists of analyzing the curves associated to the following polar expressions:
![]()
![]()
Where a,
b and k are constants.
CARDIOD
AND LOOPED LIMACONS
Let’s start fixing k = 1 and varying
parameters a and
b.
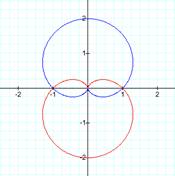
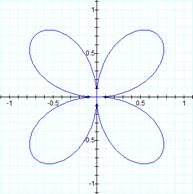
Consider the simplest case when a
= b = 1 to draw our initial graph of the expressions. Figure 1 below shows the graphs:
|
|
|
|
|
|
|
Figure 1(a) |
Figure 1(b) |
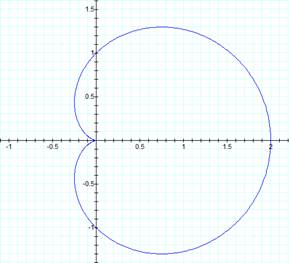
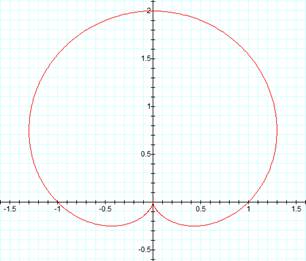
These curves are called Cardiods and, according what the figure 1 suggests, when the polar expression consists of a cosine, the curve will be symmetric with respect to x-axis. On the other hand, if the polar expression consists of a sine, the curve will be symmetric with respect to y-axis.
We should observe the shape of the curve when we make vary one of the parameters a or b. Let b = 1, and let’s vary a for the expressions. Animation 1 below shows the effects of parameter a on the graphs:
|
|
|
|
|
|
|
Animation 1(a) |
Animation 1(b) |
On the other hand, we could also consider the effects of parameter b when it varies, and a is fixed a = 1. Animation 2 shows this idea below:
|
|
|
|
|
|
|
Animation 2(a) |
Animation 2(b) |
Still another interesting observation is to see what happens when a = b. So, we can make them vary at the same time for the same values. Animation 3 below shows the effects on the graphs:
|
|
|
|
|
|
|
Animation 3(a) |
Animation 3(b) |
The latter animation gave us a good starting point to analyze these polar curves. We saw that when a = b the shape of the curve is always a cardiod; the only difference is its size, which is obviously related to the value of a. Actually, it is possible to generalize that the curve is always a cardiod while |a| = |b|.
The above explanation allows us to separate our analysis for two more cases. In other words, considering the above explanation, it just remains to explore and conclude what happens when |a| > |b| and |a| < |b|.
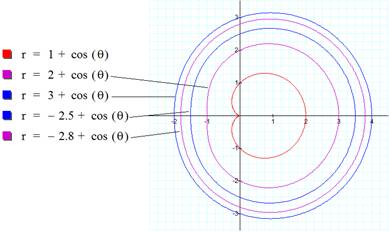
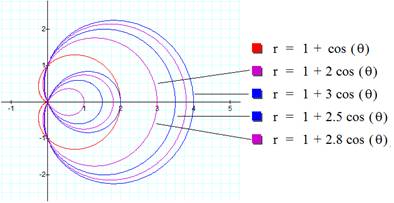
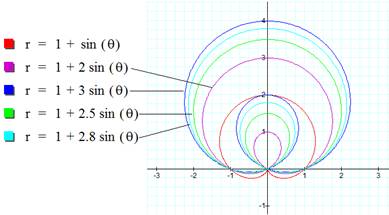
To determine the effect when |a| > |b|, consider the figure 2 and figure 3 below:
|
|
|
Figure 2 |
|
|
|
Figure 3 |
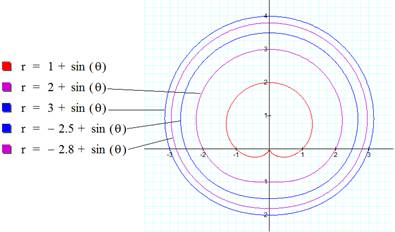
Thus, we can appreciate that when |a| > |b|, the cardiod not only increases its size but also the “heart” indentation is taken away from the coordinate system’s origin while |a| increases.
Similarly, we could analyze what happens with the graph when |a| < |b|. Consider figures 4 and 5 below:
|
|
|
Figure 4 |
|
|
|
Figure 5 |
From the figures above we can conclude that when |a| < |b|, the curve make a loop through the coordinate system’s origin. These looped curves are also known as Looped Limacons.
N-LEAVED
ROSE
Now we will fix a and b, and we will vary parameter k. First, we will consider a = b = 1 which make the polar expressions as follow:
![]()
![]()
Also, we should observe animation 4 below which shows what happen when k varies from -4 to 4:
|
|
|
|
|
|
|
Animation 4(a) |
Animation 4(b) |
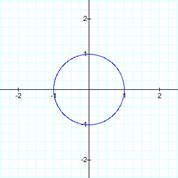
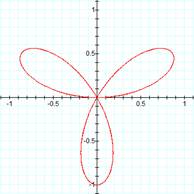
According to what the animation showed, we distinguished five curves that seem to be well-defined curves. These five curves are a circle, a cardiod, a 2-leafed “flower”, a 3-leafed “flower”, and a 4-leafed “flower.” We will refer the other curves as intermediate stages for now. Here is a summary of the curves before mentioned for the expression with sine:
|
SUMMARY FOR |
||
|
Circle |
k = 0 |
|
|
Cardiod |
k = 1 and -1 |
|
|
2-leafed “flower” |
k = 2 and -2 |
|
|
3-leafed “flower” |
k = 3 and -3 |
|
|
4-leafed “flower” |
k = 4 and -4 |
|
The last three curves are known as n-Leaved Roses.
The canonic polar expressions for n-leaved roses are:
![]()
![]()
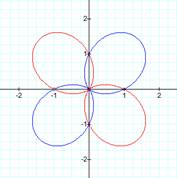
As you probably noted, the value of k seems to be related to the number of leaves when k is an integer larger than 1. Let’s fortify our conjecture by observing the following sequence of graphs for the expression with sine:
|
SEQUENCE FOR |
||
|
k = 2 |
4 leaves |
|
|
k = 3 |
3 leaves |
|
|
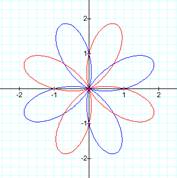
k = 4 |
8 leaves |
|
|
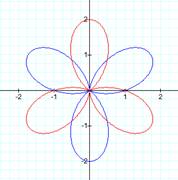
k = 5 |
5 leaves |
|
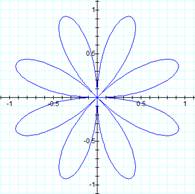
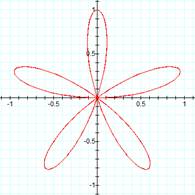
So, we can easily conclude that k indeed is related with the number of rose’s leaves. Actually, if k is odd, then number of leaves is equal to k. On the other hand, if k is even, then the number of leaves is 2k. for the expression with cosine the conclusion is the same.
Finally, to understand the effect of b on the rose, we will start considering the polar expression with cosine. Observe the animations below:
|
|
|
|
|
|
|
Animation 5(a) |
Animation 5(b) |
Similarly, we can see the effects on the polar expressions with sine:
|
|
|
|
|
|
|
Animation 6(a) |
Animation 6(b) |
While |b| increases the graph enlarges its size. An interesting effect occurs when the value of b changes from a positive number to a negative one (and vice versa) since the curve seems to be reflected around the coordinate system’s origin.
THE LIMACONS
CURVES
The curves associated to the general polar expressions
![]()
![]()
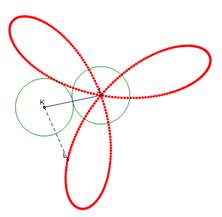
are the Limacons Curves. The curves that we have analyzed above are examples of well-known Limacons Curves. In general, a Limacon can be formed when a circle rolls around the outside of another circle. The radius of each circle does not need to be equal each other. Figure 6 below shows an example of a 3-leaved rose:
|
|
|
Figure 6 |
Here are some animations in GSP to explore:
1) Click for a cardiod.
2) Click for looped limacon.
3) Click for a looped limacon and a 3-leaved rose.
