
Assignment 12:
Body Fat Percentage
by
Jenny Johnson
Why would this activity appeal to
students?
Popular
health books often suggest that people can assess their health status by
determining their percentage of body fat.
Since the actual process to determine one’s body fat percentage is a
complicated, expensive procedure requiring sophisticated tools, it is not
practical for everyone to calculate it.
The exploration of this data set with Excel will allow students to use easy,
practical body measurements to make predictions about actual body fat
percentage.
I
found a data set at http://lib.stat.cmu.edu/datasets/bodyfat
that lists the body fat percentage of 252 men based on an underwater weighing
and also includes the circumference measurements for various body parts of
those same 252 men. There are a
total of 15 variables included in the data set which
include age, weight, height, neck circumference, chest circumference, abdomen
circumference and hip circumference.
I then entered the data from the internet into
a spreadsheet on Excel. Data for
seven of the subjects is shown below.

How could we analyze the data in Excel?
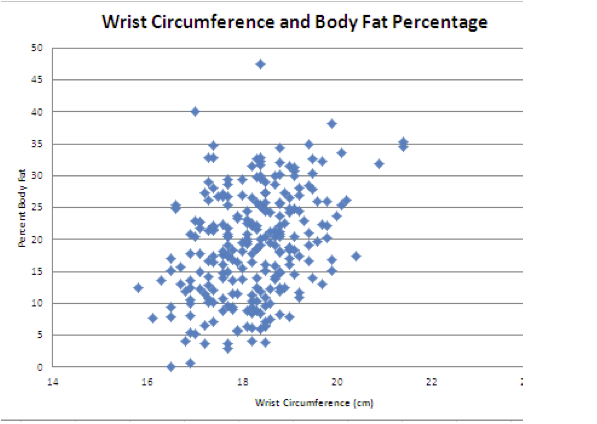
We can make scatterplots
in Excel with any of the variables listed in the dataset as the explanatory
variable and the body fat percentage as the response variable. Since there is data for so many
subjects, it is easiest to construct this scatterplot with technology. The scatterplot with wrist circumference
as the explanatory variable and body fat percentage as the response variable is
shown below.
We
can examine the strength of the association between the two variables by
finding the line of best fit and the correlation coefficient.
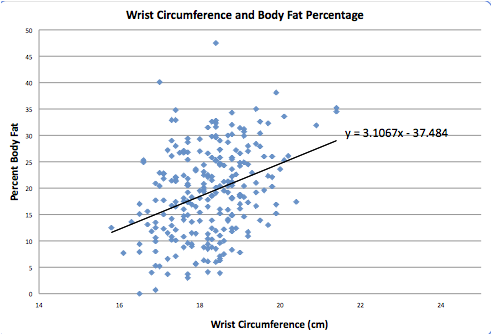
Thus, Excel calculates the
line of best fit and the correlation coefficient, r = .346575.
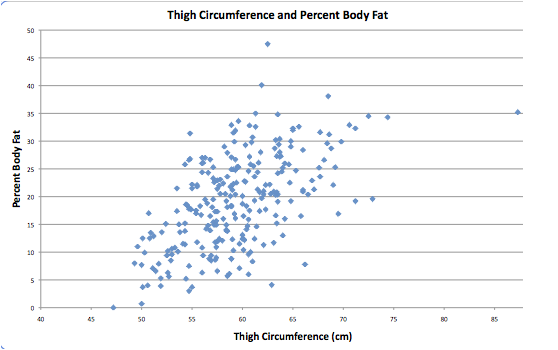
What accurately would the thigh
circumference predict the body fat percentage?
First
we construct a scatterplot with thigh circumference as the explanatory variable
and body fat percentage as the response variable.
Now
let us construct a line of best fit on Excel and calculate the correlation
coefficient.
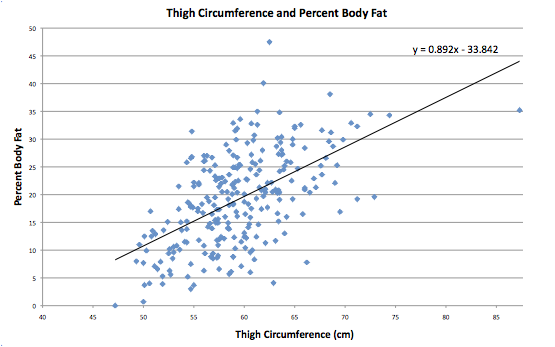
The
correlation coefficient r is .559608.
Thus, the thigh circumference is a better predictor of body fat
percentage than wrist circumference.
What does the correlation
coefficient mean in these explorations?
In
generic terms, a correlation coefficient measures the strength of the linear
relationship between two variables.
In this situation, the correlation coefficient measures how well the
circumference measurement linearly predicts a person’s body fat percentage. Since an r of 1 means the two variables
have complete linear dependence and 0 means the two variables have no
correlation, then a number closer to 1 indicates a stronger association. Thus, thigh circumference was a better
predictor of body fat percentage than wrist circumference because .559608 is
closer to 1 than .346575.
Which variable would be the best
predictor of body fat percentage?
The
table gives us the following possible predictors: age, weight, height, neck
circumference, chest circumference, abdomen circumference, hip circumference,
thigh circumference, knee circumference, ankle circumference, bicep
circumference, forearm circumference, and wrist circumference. At first glance, we could eliminate age
and height since one’s body fat percentage would not depend on either. We could also predict that abdomen and
thigh circumference might be better predictors than knee and wrist
circumference.
We
can calculate the correlation coefficient for all 13 of these variables to see
which is the best predictor of linear dependence with body fat percentage.
![]()
The
abdomen circumference has the correlation coefficient closest to 1, r =
.813432285. Chest circumference
with r = .70262 is also a fairly good predictor of body fat percentage.
After creating scatterplots, lines
of best fit, and the correlation coefficient for each of the variables, we can
discuss the following questions.
If you knew someone’s
wrist circumference, would you feel comfortable predicting their
body fat percentage based on the linear regression analysis we conducted?
What
if you knew someone’s weight? Or
height? Or neck circumference? Or chest circumference?
With
which measurement would you feel most comfortable predicting someone’s body fat
percentage? Why?
What
is the meaning of the correlation coefficient in this analysis?
Based on these data, do
you feel more comfortable predicting a man’s body fat percentage given one of
his measurements or a woman’s?
Why?
What
else could we explore with these data?
Students
could also gather data by measuring the circumference of one of their body
parts listed in the chart and use the corresponding regression line to predict
their own body fat percentages.
For
your own explorations of the data set, click here.