
Roxanne Kerry
Write up for Problem 4 in assignment 10:
I am considering the following problem:
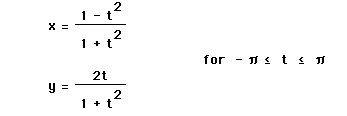
When
you graph it as written, you end up with an incomplete circle (shown
below) with a radius of 1.
By exploring the problem using Grapher (a program similar to Graphing Calculator you can access on a macintosh laptop), we can see that the unit circle is what is created as the limit of t goes from negative infinity to positive infinity. As t ranges from zero to negative infinity, we see the bottom half of the semi-circle move along the bottom half of the unit circle (and similarly with top half of the semi-circle approaching the upper half of the unit circle).
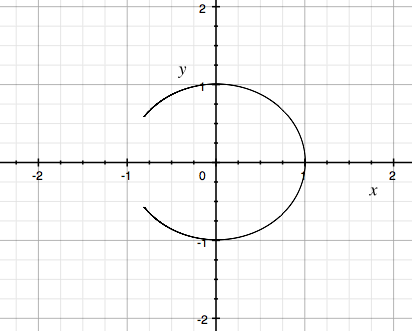
By graphing the converse of this equation, by switching x and y, we see now that the semi-circle is rotated by 90º.
By
playing around with this semicircle which is also the unit circle
missing a piece, we can find the portion of the unit circle the
original equation with parameters -π to π left out, which is -π/6
to -2π/3. When you combine these two semicircles, you are left with
exactly the unit circle. When you change the parameters of the
original equation, it becomes more difficult to find the exact region
that is missing and filling it in with the second equation.
Rather than just changing the parameters of the equation, you can begin to investigate changes you can make to the actual parametric equation. One thing I investigated was changing the signs in the original equation to see how the graph changes. I think this would be an excellent way of introducing high school students to what parametric equations really mean by changing small parts of an original equation.
Interestingly enough, if you change the signs of everything in the equation to end up with the negatives of the original parameters, it results in the same graph! I realized this was because our t is ranging from negative π to positive π so the inverse would just be ranging from positive π to negative π, which, of course, would result in the same graph.
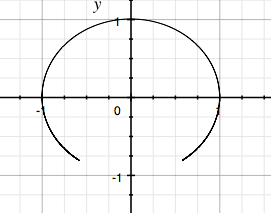
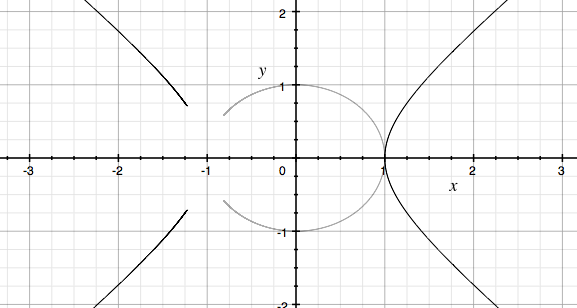
If
you change the signs of the variable t in both equations, you end up
with the interesting graph of
If you notice, there is a hole in this hyperbola exactly where the hole in the semicircle was for our original equation, but rather than having a semicircle, you have a “semi-hyperbola” beginning at positive 1 and negative 1 (so that the unit circle could fit tangent to the two innermost points of the hyperbola, as shown below).
Similarly,
you can change the signs of t in just the x(t) equation or just the
y(t) equation to discover more of what exactly making changes to a
parametric equation really does. If you change the signs for just
the t in the y(t) equation, you end up with
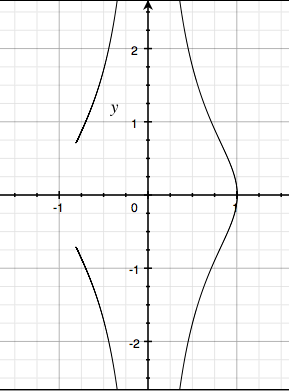
So you can see that the parameters for x did not change, but the parameters of y were stretched from negative infinity to positive infinity rather than being enclosed by [-1,1].
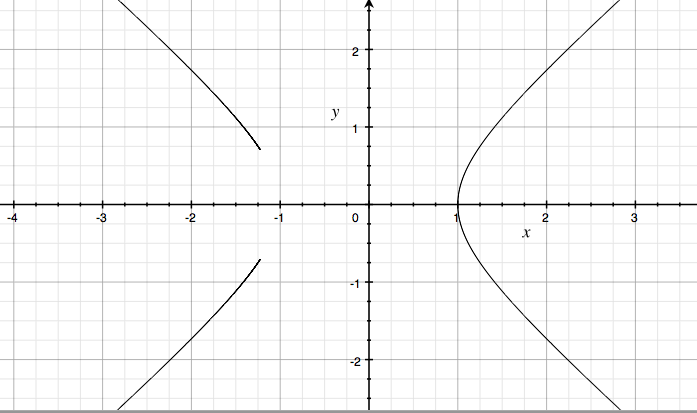
Or, you can change the signs of t in just the x(t) equation, to end up with the graph of
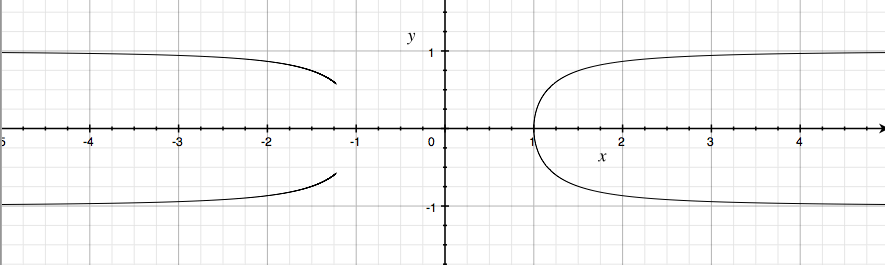
So
as you can see above, the parameters for y did not change, but the
parameters for x were reversed by changing the signs of t, since the
y values are still ranging from -1 to 1, but the x values now range
from negative infinity to -1 and 1 to positive infinity.
So in conclusion, there are many ways you can explore a parametric equation such as this one to see what the different parameters mean and how to change various parts of the graph created by the parametric equation. By exploring this equation we came to a few conclusions about what the changes made could be generalized to be for other similar parametric graphs. By switching the parameters of x and y but not changing any part of the actual parameter equations, the shape of the resulting graph does not change, but the graph simply rotates by 90º. By changing the signs of each parameter equation, you will end up with the same graph if your parameter (t) ranges over a symmetric range (such as -π to π as we had). By changing the signs of just t, or the powers of t, you change the range of the x values or y values, depending on which parameter equation you changed. If you change the signs in front of t for the x parameter equation, the range of x values changes, and similarly if you change the signs in front of t for the y parameter equation, the range of y values changes.