
Roxanne Kerry
Roxanne
Kerry
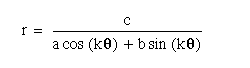
For my eleventh write – up , I chose to investigate the following problem in polar coordinates:
But
to begin, I am not all that familiar with polar coordinates and polar
graphs in the first place. So I want to break this up into a few
separate easier problems to investigate: a
cos(kt) + b and a sin(kt) + b.
First, for the most basic, we will consider a cos(kt) + b and a sin(kt) +b for a=1 and b=0, and see how the basic graph looks as we vary k:
As you can see, the number of “loops” or “petals” in the graph changes as we vary k in both instances, and the only difference in the graphs is the orientation on the coordinate plane. When k=1 for our cosine equation, we have a circle to the right of the coordinate axes, and when k=1 for our cosine equation, the same circle appears below the coordinate axes. We also get this same shift as the only difference between the other similar values for k in each case.
Furthermore,
there also seems to be a difference in even and odd values of k and
the number of loops, or “petals” that appear in the graph. For
even values of k, it seems, there are 2k “petals” and for odd
values of k, there are just k “petals”. Additionally, when k
becomes negative, the graph simply reflects across the appropriate
axis. So what happens if a is not 1? Let's fix k, now, and see what
changes as a varies:
As
suspected, since k is not changing, the number of petals on the graph
is not changing. a simply expands or contracts the graph, and
negative a just expands by a and reflects the graph. Now what about
if we add the two graphs together?
This
graph surprised me. When you keep the a and k the same for each part
of the graph, we simply see the same shifts as before when a or k
varies, except the orientation around the axes is shifted slightly.
When a is different in one of the two expressions, the larger of the
two values is used for the graphs. When k is the same for both
graphs, we again see the same thing. However, when we set k to be
different in the two trigonometric expressions, interesting things
happen... See below:
It seems as if it tries to take the loops of both parts of the graph as k is varying.
Now, onto the exciting part... let's take a look at that original equation,
After
graphing this, we see that, just as a and b did not do anything
except for expanding or contracting the graph, c does the same thing
here. However, when we vary k, the inverse, it seems, of what we saw
before is graphed. See below:
Polar graphs are both very interesting and very complicated to work with, but if you break down a very complicated equation, it can make the whole equation more understandable to work with, and it can make more sense. So in conclusion, if a problem is too difficult to work on at first, look at a simple case first, or a part of the problem or both... it helps!