
Roxanne Kerry
Roxanne
Kerry
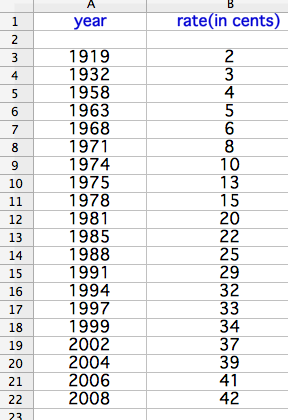
For this write-up, I am exploring using and analyzing sets of data using a spreadsheet. In particular, I chose to investigate the price of postage stamps over the past century. The raw data collected is shown below as follows:
One
of my favorite aspects of using spreadsheets is that many programs
with spreadsheets are both easy to use and easily accessible, and
also have methods to plot points from the entered data and find and
also show regression lines and curves given the data.
These can be a wonderful asset in the high school mathematics classroom, especially when the students get to the units on Data Analysis and Probability. The students can use real data, and for many points or very large numbers, spreadsheet programs can be useful and more realistic to use. If the students do not have access to Microsoft Excel, OpenOffice has an excellent open source alternative that anyone can download from the internet for free that is very similar to Excel.
One of the first things I would do with my data, in any case, and what I did in this case, is to plot the points on a graph to create a scatter plot, and connect the points to see what the shape of the actual graph is: (see below)
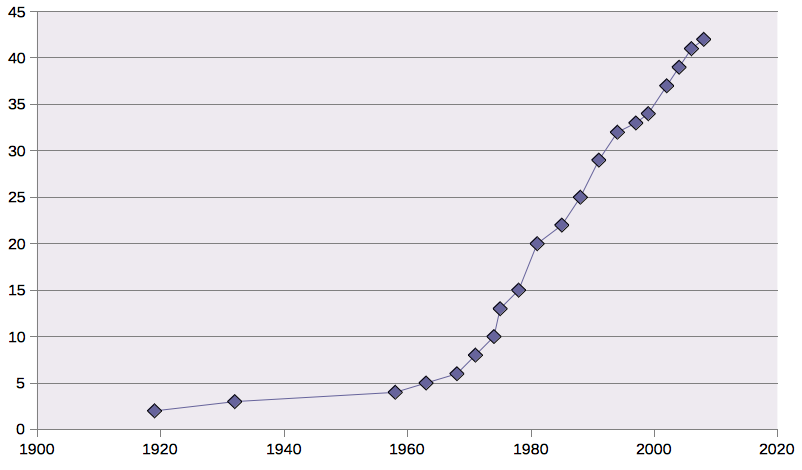
In
this case, we can see that the data is certainly not linear, but to
illustrate a point to high school students about a line fitting a
small portion of a graph versus the entire graph, it may be a good
idea to see what the linear regression line would look like: (see
below)
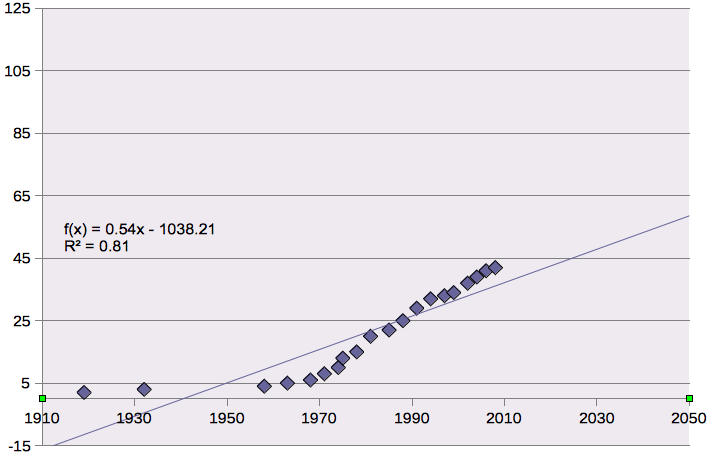
As we can see very well from this illustration, the two early points in the data made it so that the linear regression line does not seem to represent the data at all, and this regression line would likely become an even poorer predictor of postage stamp rates in the future, as the points on the graph seem to be increasing much faster than our linear regression line plotted.
We can then try some other types of regression curves; I chose to look at a power function and an exponential function. First, the power function (see below):
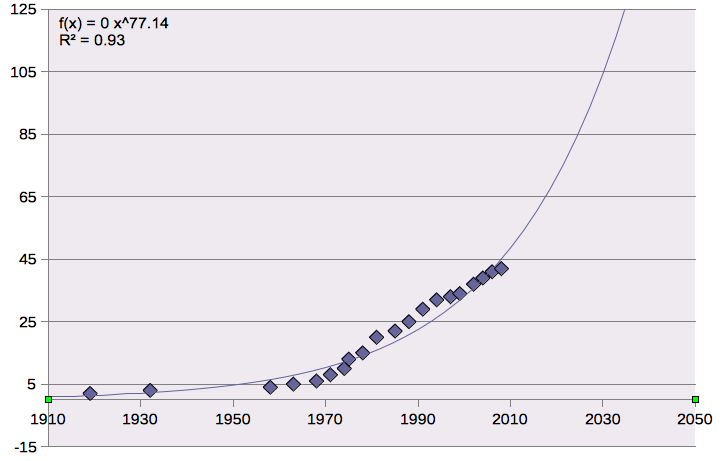
As
we can see, this is a much better representation of the data, and
seems to be closer to predicting the general trend of the data, but
it still is not perfect. 1960 to 1975 the estimates are a little
high, and 1975 to 200 the estimates are a little low, but in general
this is a decent fit. Let's now try an exponential regression curve,
and see if it fits the data more closely (See below):
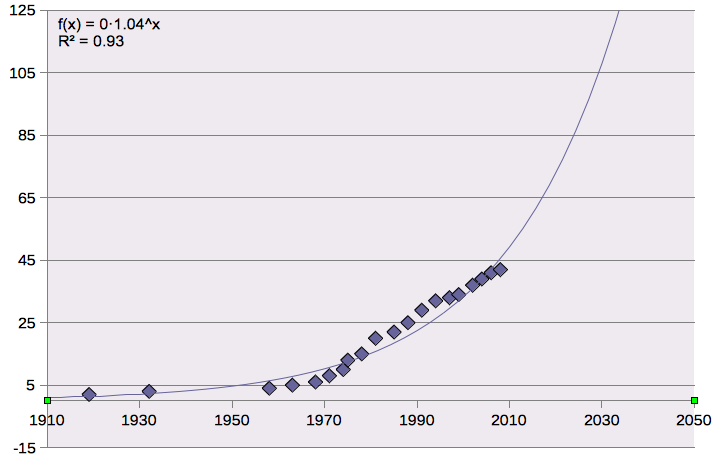
This
graph seems to be, although a better fit than the linear regression,
not quite as precise as the power function. Fewer points fit with
the estimated graph, and it seems to be increasing much faster than
the actual points on the graph are.
My conclusion: The power function is a good approximation for the general trend of the data. There are about the same amount of points below the curve as there are above it, and students in a classroom could even observe this and see if there is a good reason why the data was low for a little bit and higher for a little bit (are there any connections in history?). So according to the power function regression curve, we would expect the price of a stamp to be a dollar around the year 2025, for it to be 65 cents around 2012, and for the next 3 cent increase to take place around 2010.