
Roxanne Kerry
Roxanne
Kerry
For my second write up, I chose to investigate what happens when two coefficients in a quadratic equation stay the same and you vary the third coefficient. In particular, I looked at
where
the values of the leading coefficient, a, vary, but the coefficients
of 1 and 2 stay the same, and then I also investigated what happens
when the coefficient of the x term varies, while a=1 and the constant
coefficient is 2. Also, I did a third investigation where I fixed
a=1, the coefficient with x to be 1, and varied the constant
coefficient.
Here were my results:
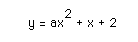
I chose varying positive and negative values for a, as well as zero, including
a = -5, -2, -.5, -.1, -.05, 0, .01, .2, 1, 3, and 5, and came up with the following graph
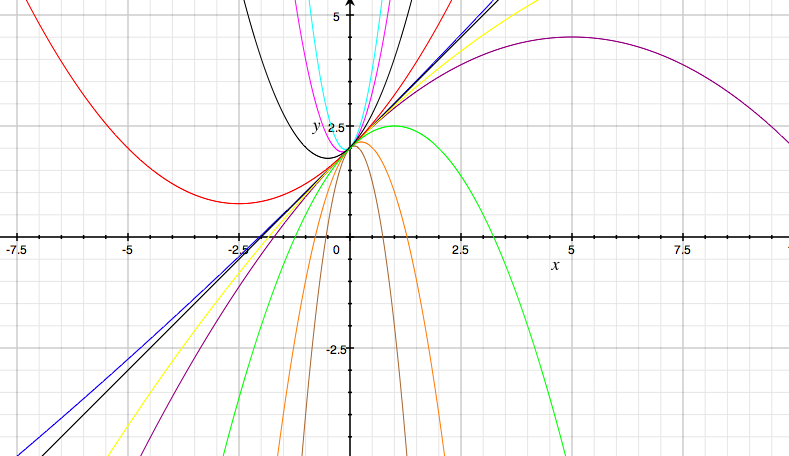
It seems as if all of the graphs seem to share one point, and if we zoom into the equations, it becomes clear that this point of intersection is in fact where all of the graphs meet on the y axis (x = 2). This makes sense when one considers that the y- intercept of the graph in any of these cases is going to be at 2, and could be a nice way of getting students to actually stop and think about what values in a graph actually represent, specifically their intercepts.
As
the coefficient of x squared, “a”, varies, we can see that the
parabola “flattens out” in a sense, so as to approach the line x
+ 2 = 0. As the values of “a” become negative and larger, they
seem to be a reflection of the corresponding positive value of a
about the line x + 2 = 0. This could also introduce the idea of
reflections, or if the students have already been exposed to
reflections, this idea could be a way of connecting reflections to
this general exploration of quadratic equations.
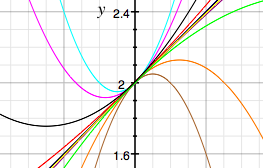
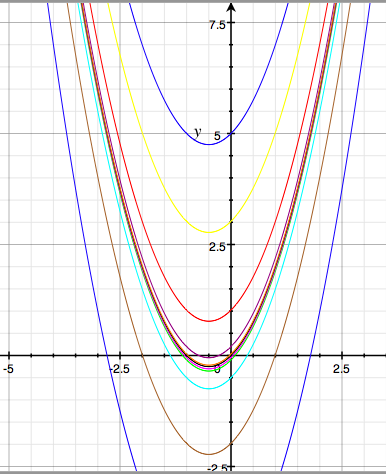
When we fix “a” to be 1, but vary the coefficient of x, some interesting things happen. I varied these points to be -5, -2, -.5, -.1, -.05, 0, .01, .2, 1, 3, and 5, just as I had plugged in for “a”, and initially would have expected something similar to the first exploration with “a” to occur.
As the graph shows, and as would be expected, the point in which the curves intersect one another is also the point on the y-axis in which each of these graphs cross, at 2. Again, this is very straightforward algebraically, and should make sense to high school students.
As far as how the graphs move as the value of “b” varies, it does not approach the curve made when “b” is equal to zero as it did in our previous investigation when “a” equaled to zero, but rather, the opposite happens, and the curves stretch out to where they approach the y-axis from each side. As “b” gets larger with larger positive numbers, the curve “flattens out” to the y-axis from the left side. As “b” gets more negative, the curve “flattens out” to the y-axis from the right side.
The exploration of varying “c” in the equation should be somewhat more familiar to high school students, or perhaps not. An important new discovery when varying the constant term and fixing the x squared and x terms is that each positive curve fits into the curve below it, and the more larger negative values we put in for “c”, the wider the graph goes, curving around all graphs with less negative values for “c”, as shown below.
This
seems to show that, as the values for “c” get larger and more
positive, the width of the curve shrinks and the graph moves up more
(to the corresponding point of “c” on the y-axis). This ends up
being quite different than a similar investigation of x squared plus
varying values of a constant term. A common misconception of
students may be that the graph simply shifts up or down as the point
in which it crosses the y-axis changes, and not realize that the
graph also gets more or less wide.
In conclusion, this is a far richer discussion and exploration into quadratic functions and how their coefficients affect the graphs than is commonly used in the classroom. However, assuming the students have access to a computer with graphing calculator or grapher or a similar software, the students in a high school classroom could really get a lot out of such an exploration. For that matter, even if there is not a full set of computers readily available for the classroom to use, using a class set of graphing calculators and their zoom features would suffice.