
Roxanne Kerry
Roxanne
Kerry
Final Project, Part B:
I decided to do the second part of my final project first, to keep in the spirit of the write-ups that are preceding this big question in the final project. It has been a long journey through learning new computer applications, such as Geometer's Sketchpad and Grapher (a similar program to Graphing Calculator), not to mention learning how to make a web page and post assignments onto it. Out of all of the assignments and explorations we have done this semester, I think I enjoyed assignment 12 the most, so that is why I chose to do my final and additional write-up from assignment 12.
I decided to explore a problem using tree data. What struck my interest in this problem is the missing data it had. Although it seemed somewhat similar to my exploration on stamps with my assignment 12, this one seemed as if it might be a little bit more of a challenge. The data given is a chart, as follows:
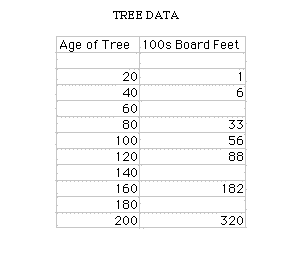
I
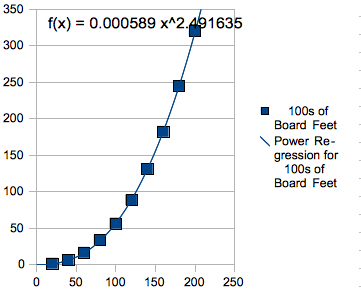
began by creating a scatter plot of the data given, to see the
general shape of the data:
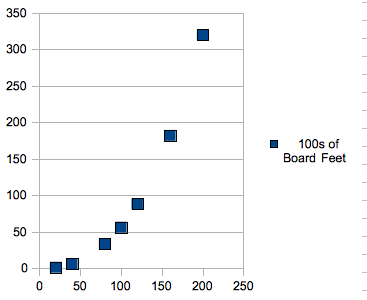
Immediately,
it becomes pretty obvious that the data of the graph is not linear,
as the points seem to increase much more rapidly as the tree gets
older. My plan is to find the curve that best fits the data, and use
that curve to estimate the points for the missing data. My guess is
that this best fit curve is best represented by either a power
function or an exponential function, so I will plot both below:
Here is the exponential function:
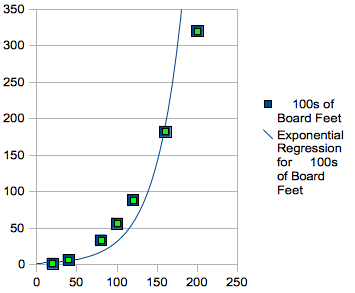
This
graph, although a better approximation that a linear regression line
would be, seems to be increasing too rapidly, and may approximate
data within this range decently, but I would worry about using this
graph to estimate data past the range of the given points on the
graph.
Here is the power function:
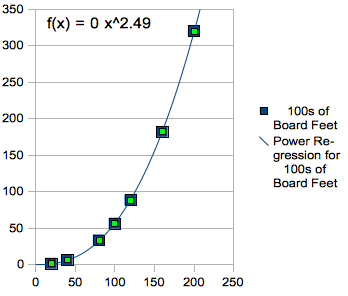
Wow!
This graph seems to be a very close approximation to the points we
plotted! I think this is the regression curve I will use for the
missing data points.
When using the power function generated by OpenOffice Calc (The open source version of Microsoft Excel), F(x)=.000586*x^2.492609 gives approximately 16 hundreds of board feet for a 60 year old tree, 131 hundreds of board feet for a 140 year old tree, and 245 hundreds of board feet for a 180 year old tree. As I plotted these points on the graph, they make the graph look even more complete:
Now what else can we do with this data? First of all, and most easily, we can use how old a tree is to estimate how many hundreds of board feet it will generate. For example, if we have a 350 year old tree, then we can plug this value into the function generated to get that the tree would yield approximately 1285 hundreds! Additionally, we could use this function to determine how old a tree would need to be if we needed a specific amount of hundreds of board feet by manipulating the problem a little bit:
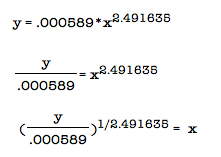
So
let's say, for example, that we want to have 250 hundreds of board
feet. About how old would the tree have to be to provide this much?
We can simply use this equation to get 182 years old.
Final Project, Part A:
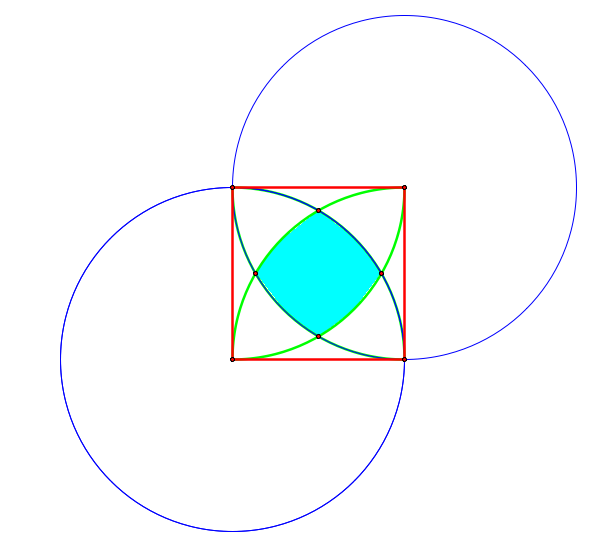
For this final project, we have to construct a square with quarter circle arcs creating an interior “rounded square” shape in the middle of the square, and find its area in terms of the sides of the square. To begin, I replicated the shape we are to be working with in the Geometer's Sketchpad:
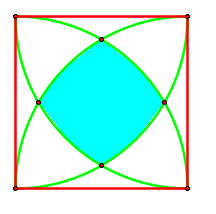
I
created this shape by first making a square (I have a GSP tool which
can do this for you). Next, I took each corner of the square as the
center of a circle and connected it to the next point to its right,
clockwise, to create four circles with radii of the same length as
the sides of the triangle. I created an arc on top of the portion of
each of these triangles inside the square, and hid the rest of the
circles, and then shaded in the interior by shading the interior of
the intersection of the four arcs.
Next, comes the more complicated part. I need to determine the area inside of the shaded region relative to the rest of the square. So what do we know right away? Let s= the length of a side of the square. Then the area of the square is s2. Looking at the area we need to find in relation to one of the circles, we see that the area of the circle is 2πs, and the shaded area of the square lies exclusively in one quarter of the circle. See below illustration:
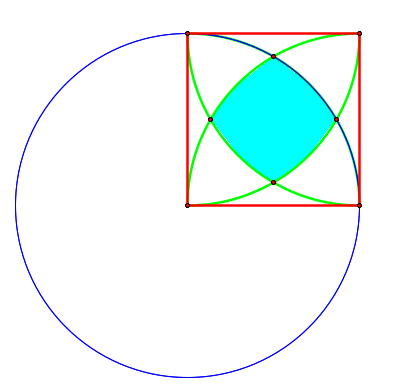
So
the area must be strictly less than ½ πs. Though this is a nice
observation, it does not tell us a lot, especially since
significantly less than a quarter of the circle is shaded.
Now let's add a second circle to see what we can do about finding a closer approximation.
If
we can figure out what the area of this region is, we become much
closer to determining the actual area of the shaded region. But in
order to analyze this and try to determine the region between two
circles, we must first go back and consider circle geometry.
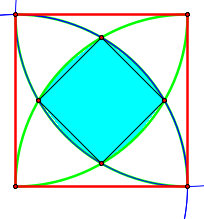
We can split this region into a square and four smaller pieces. The square we will worry about last, because I think it will not be as difficult as the four pieces (see illustration below)
So
let's try to calculate the area of each of these four smaller
regions. My approach will be arc length and the area of the sector.
What do we know so far? Consider this labeled diagram while we
explore this:
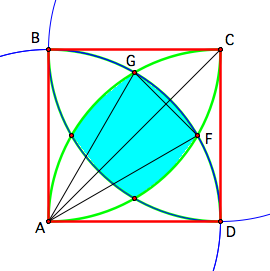
By
definition, we know that angle BAC and angle DAC will be 45º, since
AC is the diagonal of the square. Due to symmetry, angles DAF and
BAG will have the same angle measures. Consider the bottom left
circle (with B, G, F, and D as four points along it). Since angle
BAD is 90º, and the distance is the same between BG, GF, and FD, we
conclude that angles BAG, GAF, and FAD must all be the same, so 90º/3
= 30º must be these angle measures. Hence, the sector GAF has an
angle measure of 30º, or π/6 radians.
We could find the area of the sector, but this will give us the little region we want plus the triangle AGF. But wait! If we know these two values, we can find subtract to find the area of the smaller region! So let's try and find these two values.
To begin, since AG and AF are radii of the circles whose radii are the length of the sides of the square, the length of AG = the length of AF = the length of AD = s (as I defined it before). So we can find the area of the sector as follows: ½ t r2 , where t is the angle measure and r is the radius. This gives us ½ (π/6) s2 = s2π/12.
To find the area of the triangle AGF, we can use the Side-Angle-Side property to find the length of GF: We can use the law of cosines as follows: s2 + s2 – 2(s)(s) cos(π/6) = 2 s2 - 2 s2 (√(3)/2 ) = 2 s2 (1- √(3)/2 ). We can now compute the area of the triangle by using ½ base*height, where 2 s2 (1- √(3)/2 ) is the base, and the height is s, the radius of the circle. So the area of the triangle AGF is s3(1-√(3)/2 ).
By subtracting the two, we can get the somewhat complicated, but exact, value of s2π/12 - s3(1-√(3)/2 ).
Since the four small areas are the same due to symmetry, we can multiply this value by four to get the outer four shaded regions, and then all we have to do is find the area of the square inside the shaded region. Since we found the side length of the square, square this value to find the area.
So the total area of the shaded region is as follows:
4(s2π/12 - s3(1-√(3)/2 )) + (2 s2 (1- √(3)/2 ))2.
Note: This may not be in the simplest form; however, I am confident this formula will yield the correct area of the shaded region given a square with side lengths s.
Merry Christmas and a Happy New Year!!!