Rayen Antillanca.
Assignment 10
|
For various a and b, investigate |
|
For |
|
To investigate, I am going to
consider the next parametric equation
|
||
First
Investigation
|
a=b |
|||
|
|
|
|
|
|
|
|
|
|
|
As you can see, the equation gives a
circle of radius 1 |
|||
|
Consider the system
Taking squares of both equations in (1),
we obtain
Adding both equations in (2) we get
|
Second
Investigation
When
a>b
|
|
|
||
|
|
|
||
|
When
We might proceed as follow: we use the
double angle formula for the first equation in (1), and we square the second
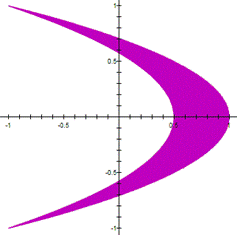
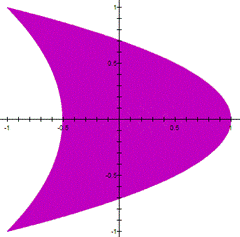
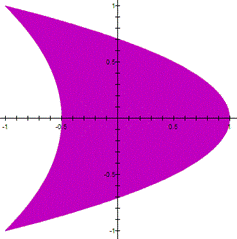
equation in (1) to get Adding the equations in (2), we obtain The latter represents a parabola, so that
the parametric system (1) is a part of the parabola (3). |
|||
|
Now, what happens
when a and b increase? |
|||
|
|
|
|
|
|
|
|
|
|
|
|
|
||
|
|
|
||
|
When |
|||
|
|
|
|
|
|
|
|
|
|
|
|
|
||
|
|
|
||
|
When |
|||
|
|
|
|
|
|
|
|
|
|
Third
Investigation
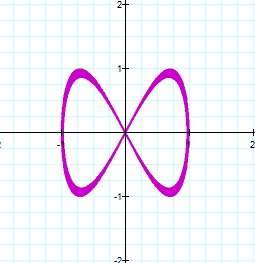
When
a<b
|
|
|
|||
|
|
|
|||
|
When |
||||
|
|
|
|
||
|
|
|
|
|
|
|
|
|
||
|
|
|
||
|
When |
|||
|
|
|
|
|
|
|
|
|
|
|
|
|
||
|
|
|
||
|
When
|
|||
|
|
|
|
|
|
|
|
|
|
Fourth
Investigation
As
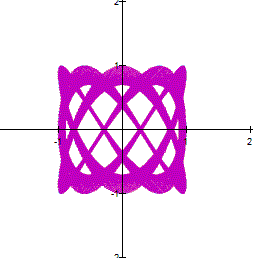
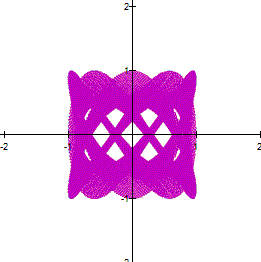
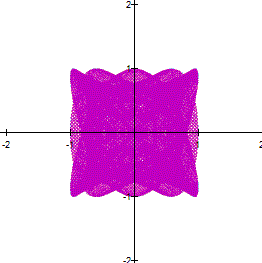
you can see in the parametric equation
![]()
When
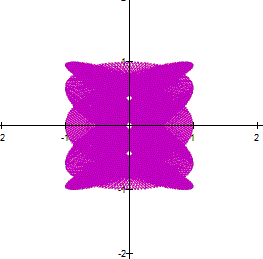
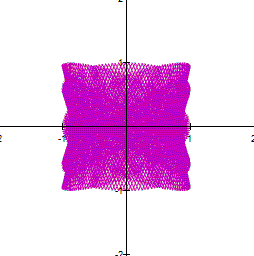
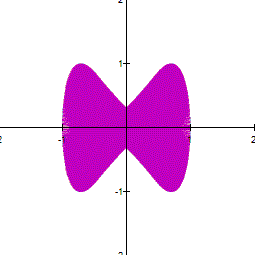
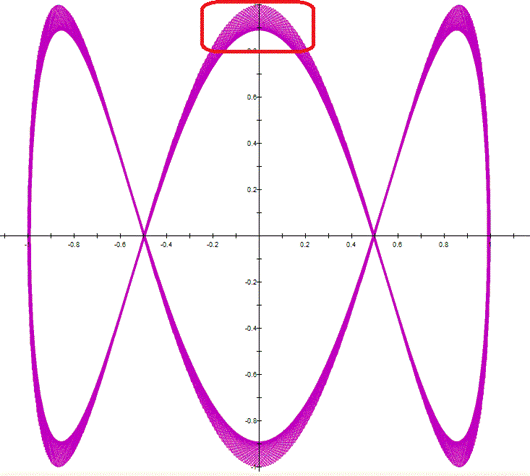
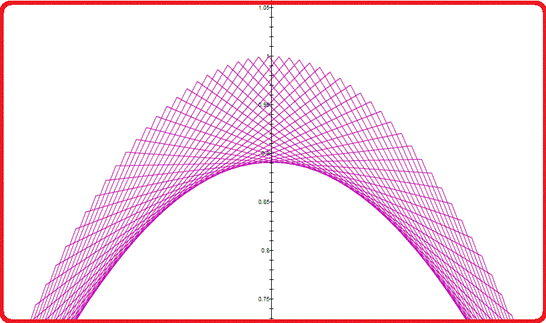
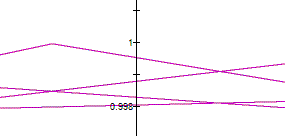
a and b are large, the curve looks thicker. However,
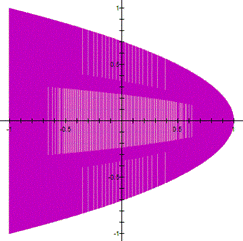
if you zoom in a part of the curve, you can see a net. For example the next
parametric equation
|
The graph of |
|
|
The next graph is a zoom of the curve |
|
This
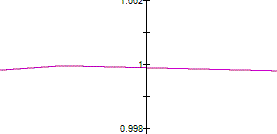
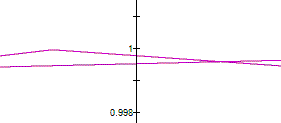
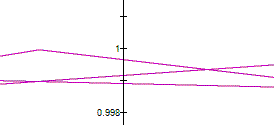
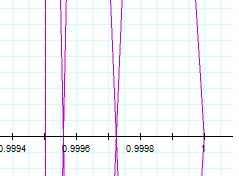
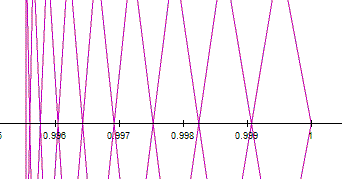
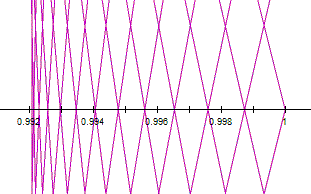
net is related to the value of a and b. The next set
of figure show how the net is made. The relationship between a and b is ![]() .
All these figure are zoom in.
.
All these figure are zoom in.
|
|
|
|
|
|
|
|
|
|
|
1 line |
2 lines |
3 lines |
4 lines |
So,
the parametric equation ![]() has 30 lines as
has 30 lines as ![]() .
There are as many lines as the value of a.
.
There are as many lines as the value of a.
However,
when ![]() or
or ![]() the parametric equations have a different
shape, for example
the parametric equations have a different
shape, for example
|
When
|
||
|
|
|
|
|
|
|
|
This
graph forms a net, but for some value of ![]() and
and ![]() this net looks like losing lines. I am going
to explore to find at which value the net reduces its number of lines. The net
behaves similar to what was shown in the previous investigation, the number of
lines is given by the value of a. The the next set of images shows this.
this net looks like losing lines. I am going
to explore to find at which value the net reduces its number of lines. The net
behaves similar to what was shown in the previous investigation, the number of
lines is given by the value of a. The the next set of images shows this.
|
|
|
|
|
|
|
|
|
6 lines |
18 lines |
24 lines |
Now,
observe the next set of images.
|
|
|
|
|
|
|
|
|
|
|
This investigation suggests that when
a=600 and b=300 the graph of these parametric equations reaches its maximum
number of lines. Then, when a increases the graph looks thinner |
|||
What
happens when a=300 and b=600?
|
Summary |
||||||||
|
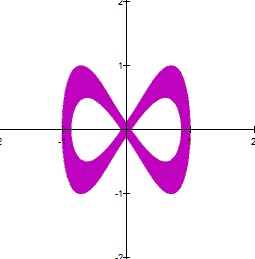
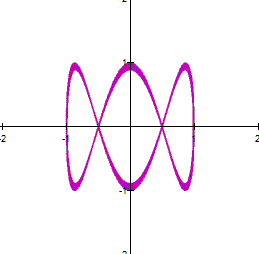
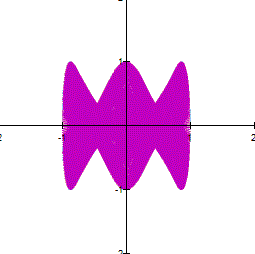
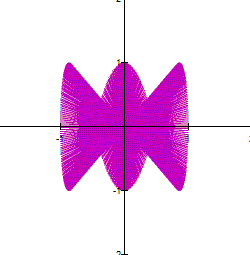
Considering
the next parametric equation When
When
a>b or a<b the investigation suggests six different graph shapes. The
six graph shapes are given for the follow relationship.
I
would like to add that there exist more than these six graph shapes, actually
I think there are a lots of them. When
the value of When
|
|
Note: All graphs of this webpage were made with
Graphing Calculator 4.0 |


