The sum, product, quotient, and composition of linear functions by Jiyoon Chun
Before I start
Function is a special relation of two quatities. All points on a fuction vary according to certain rules.
Thus, the idea that the sum of two functions is just adding two equation is not enough.
This idea nither touching the concept of functions nor helpful to the students when they face more complicated situation such as domain, range and the resonable reason why the shape of the graphs are to be cahnged.
Since the sum, product, quotient, and composition of functions creat new functions, we have to see the result as aother relation of x and y which has more rules.
First, I will demonstrate why the sum, product, quotient, and composition of functions produce a new relationship of x and y.
Then I will investigate what affects the shape of graphs by carefully looking at the slop, x and y- intercepts of the given linear fuction.
0. Functions as relations
Definition of a function:
Since we strongly emphsize the definition of function in school, I think a lot of students can say what the definition of function is.
Function is a relation which a element in domain correspond to exactly one element
Thus, it does not necessarily need to has a particular rule. A set of ordered pairs can me a function as long as the domail is well defined.
However, set of ordered pairs need to satisfy particular rules to be a linear function.
About terminology:
I do not like to call x as just x.
In equation, normally x is a unknown variable.
In function, usually x is a dependent vaiable which is input.
In real life, x can be anything; even f infront of uck.
Thus, if we just call x as x, it is not easy to figure out what it is.
I strongly recommend to make it clear what x means before we offend anybody.
Since we set an indepent variable x, we can mutiply scalar to it, and add scalar such as ax+b.
Now the output is an dependent variable because it varies according to the input.
Let's say the outcome is dependent variable y.
This relation of independent variable x and dependent variable y is a linear function.
f(x) means we apply a certain rule to x. Actually it shows what the rule and outcomes are.
Demonstration of a linear function:
1) Example f(x)=2x+1, g(x)=x-1
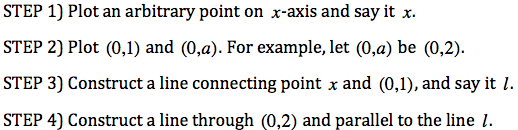
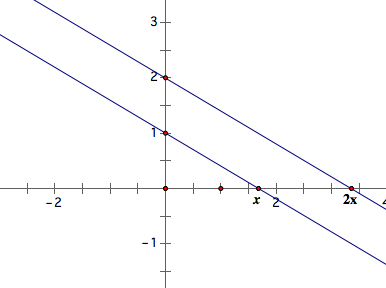
-1. On a coordinate plain, plot a rendom point x. Since the x is rendom, this is our dependent variable.
-2. Now dilate twice the independent variable x, and add 1 so that it becomes 2x+1. As you see the animation below, 2x+1 moves along with x. I cannot move 2x+1 alone, because it is depent to x.
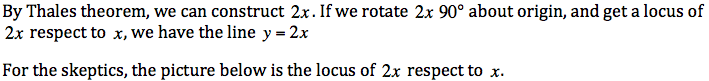
-3. Since we wnat to demonstrate the relation as ordered pair on the coordinate plane, I will rotate 2x+1 90 degree so that I can put it on y-axis.
-4. Trace a point (x,y). We can see y=2x+1
1. The sum of linear functions
First, I will work on particular example to demonstrate the concepts embedded in it.
Then I will add more examples and brief explanation.
Lastly, I will generalized it.
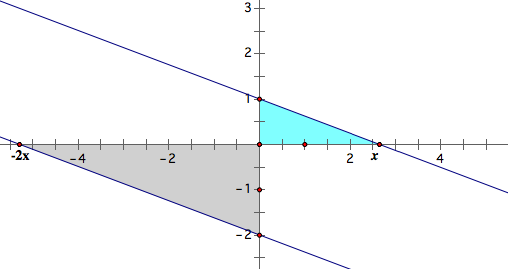
1) If f(x)=2x+1, g(x)=x-1, Then f(x)+g(x)?
- First, construct f(x) and g(x) on the same coordinate plane using the method of above.
-Now, let's think about the meaning of adding two linear funcions f(x) and g(x).
-Let h(x)=f(x)+g(x). As we can see in the equation, the independent variable x was not changed. h(x) is still a relation of the independent variable x and dependent variable y. However, the new outcome is the sum of two outcomes of f(x) and g(x).
-We have two differnet dependent variable on y-axis for the same x. Say y'=f(x), and y''=g(x). I will mark y' and translate y'' as much as y'. Now we have y=y'+y''.
Trace the point (x,y). This will give us h(x) since h(x) is the sum of two differnet outcomes.
Observation:
-1. Slope
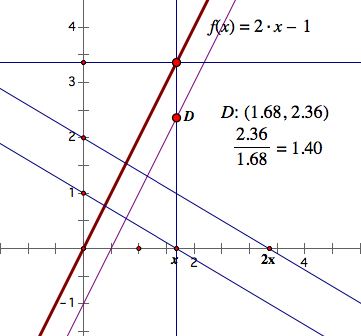
Slope is the rate of change of the dependent vaiables according to the independent variables.
As we see in the pictureof a triagles, the slope of f(x) is 2, and g(x) is 1.
Now look at h(x)=f(x)+g(x).
As we see,the outcome grows 3 whenever x grows 1.
We can also say a slop as as increasing speed where x represent time, and y represent the distance.
Since we are adding teo function, it means that we are adding two speed up.
Therefore, the new slope is the sum of two slopes.
As we well know, x and y-intercept do not affect the slope becuase it is not a rate, and are merely adding a same number whatever the independent variable x is.
Again, in the sense of speed and diatance relationship, y-intercepts indicate the starting point. Thus, it does not affect the speed which means slop in the graph.
y-intercept
Of course we have 0 y-intercept because we added f(x) and g(x). However, I want to point out more deeply about y- intercept.
The meaning of y-intercept:
-the y-coordinate where the graph hit y-axis
-the y-coordinate where the independent variable x is 0
-the starting location (since time is 0) in speed and distance situation.
Since the starting location of f(x) is 1 and g(x) is -1, the starting location of f(x)+g(x) is 0.
x-intercept
The meaning of x-intercept:
-the x-coordinate where the graph hit x-axis
-the x-coordinate where y becomes 0
-Since y=0, it is the solution of the given equation
-The time when the object hits the original or reference point
Question?
Let f(x)=ax+b, g(x)=cx+d and h(x)=f(x)+g(x)=(a+c)x+b+d. Then, the slope and y-intercept of h(x) is like a table below.
y-intercept |
slope |
x-intercept |
|
f(x) |
b |
a |
|
g(x) |
d |
c |
|
h(x)=f(x)+g(x) |
b+d |
a+c |
Can we just simply add each x-intercept of f(x) and g(x) such as we did to get y-intercept and the slope of h(x)? |
Answer
1. Algebraic reason
Since h(x)=(a+c)x+b+d, The x-intercept of h(x) should be the x value where y is 0 by the definition. Thus, x-intercept is (b+d)/-(a+c).
The multiplication of linear functions
Before I start:
I think it is important to know how to construct the multiplication of two linear functions since it ilustrates the propeties of it.
To do it, let's recall euclidean geometry.
We could construct the product of two numbers using Thales theorem.
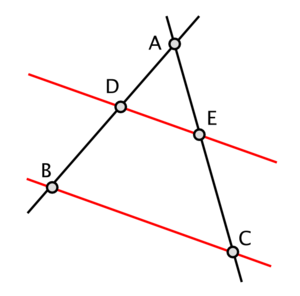
Thales theorem: AD:AB=AE:AC=DE:BC
Now, see the triangles below.
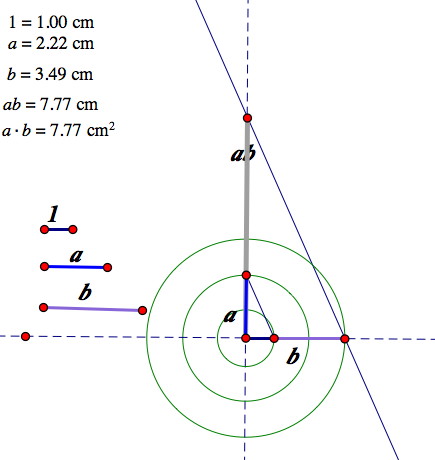
we have three measurement such as 1 (unit), a , b.
Using Thales theorme, we have 1:b=a:x.
Thus, x=ab which is the length of the gray segment.
Since we know how to construct linear functions (see 0), and the product of two numbers, we can construct the product of two linear functions.
Like I did above, let h(x)=f(x)g(x) where f(x)=2x+1, and g(x)=x-1
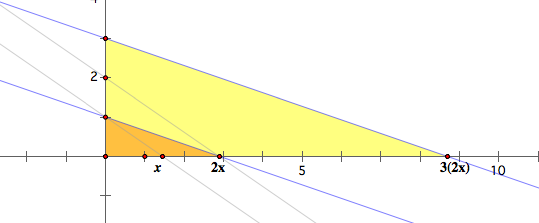
We can think h(x)=f(x)g(x) is just a product of numbers. Product numbers does not merely imply the sets of numbers. Rather, we can think of the product of numbers as the area of a rectangle.
Now, we will see h(x) as the area of a rectangle of base f(x) and height g(x). This will show a lot of properties of the product of two linear functions.
Let f(x)=2x+3, and g(x)=3x-5. I constructed the rectangle of the with f(x) and the height g(x). The yellow rectangle below is the area of f(x) and g(x). The blue segement indicate lso indicate the area of the rectangle.
First, take a look at the animation below.
| x-intercept | the axis of symmetry | y-intercept | |||
 |
 |
 |
 |
 |
|
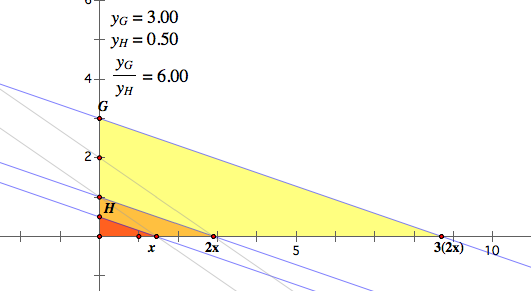
The area of the rectangle is 0. It implies that h(x)=0 because h(x) represent the area of the rectangle. In this case, the height is 0. It means h(x)=0 when g(x)=0. Thus, the x-intercept of g(x) is also the x-intercept of h(x). |
The area of the rectangle is the minimum when is at the mid point of x-intercepts of f(x) and g(x). Thus, the axis of symmetry is at the mid point of the two intercepts. | The area of the rectangle is 0. It implies that h(x)=0 because h(x) represent the area of the rectangle. In this case, the base is 0. It means h(x)=0 when f(x)=0. Thus, the x-intercept of g(x) is also the x-intercept of f(x). |
Let's take a look of h(x)=f(x)g(x).
y-intercept |
slope |
x-intercept |
|
f(x) |
b |
a |
|
g(x) |
d |
c |
|
h(x)=f(x)*g(x) |
b*d |
not defined -not a linear function |
The quotient of two linear function
I investigate at the final assignment. Click here to see the webpage about the rational function and projective geometry.
The composition of two linear functions
![]()