Parametric curves by Jiyoon Chun
What are parametric curves, and why do we learn them?
I have been using x and y function such as y=f(x) before I learned calculus. I was frustrated when I first saw parametric equations and curves, and I did not understand why we learned it. Since it was new, and I have very little motivation to learned it, I remember that I was not really good at parametric curves.
In two dimensional space, parametric equations are a pair of functions such as x=f(t), y=g(t). It was just so much work to understand this new way of expressing the curve.
As time goes by, I learned geometry, vectors, vector equations, differential equation an differential geometry, I realized that parametric equations are very useful when we analyze the curve, and understand vectors.
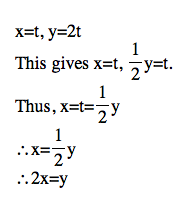
For example, let's think about y=2x.This is a line passing through the origin of slope 2.
In vector space, y=2x are the span of (1,2). Thus, it's just t(1,2). Therefore, it is the set of all points which satisfies (t, 2t). We know that the x-coordinate is t, and y-coordinate is 2t.
Is it not really surprising? How about a line in tragedies space which is not passing through the origin? I bet we all learned in this way without no questions be asked: If the direction vector is (a,t,u) and it passes through a point (a,b,c), then the equation is 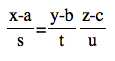 . When I asked a question what if s,t or u is zero, my teacher asked me to be quite, cause we will get there. And the teacher said when sis zero, we exceptionally write the equation such as
 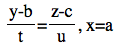 . But does this not look like a parametric equation in the sense of writing the equation separately?
I think I can give better explanation about a line in 3D geometry if I use the concept of vectors and parametric equations.
First, the line through a point (a,b,c) and parallel to (s,t,u) is (a,b,c)+k(s,t,u). I used k instead of t since I already used t for y coordinate of the direction vector.
Question: ![]()
I want to show it using 2D graph because it is much easier to see.
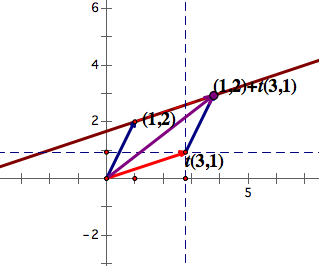
Let's plot a point (1,2) and a direction vector (3,1). Since the line is passed through (1,2), and it's slope is ![]() , we know that the equation of the line is
, we know that the equation of the line is 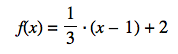 . In the picture and flash below, I plot a point (1,2) and the direction vector (3,1). It means
 ![]() This is the trace of the end point of the diagonal of parallelogram whose one side is (1,2), and the other is t(3,1). The flash below is the trace of it.
This is the trace of the end point of the diagonal of parallelogram whose one side is (1,2), and the other is t(3,1). The flash below is the trace of it.
Let's compare the trace and .
|
|
|---|---|
 |
 |
As we can see, they are the same.
Let's get back to the line in 3D through a point (a,b,c) and parallel to (s,t,u). As we confirmed above, the line is (a,b,c)+k(s,t,u).
Thus, the line is the set such that {(x,y,z)|(x,y,z)=(a+sk, b+tk, c+uk). k is a real number}. Thus, x=a+sk, y=b+tk, z=c+uk.
This give us ![]() .
.
What is s, t, or u is (or are) zero?
Let s=0.
Then we have x=a, y=b+tk, z=c+uk.
Now, the variable k does not do anything to x. x is always a no matter what Therefore, we have .
Understanding Parametric Equations
As far as I know, understanding parametric equations and curves enable us to connect the concept vectors and coordinate geometry. Moreover, we can see what is going on to all the variable such as x, y, and z according to the same variable t. This will make us easier to understand the shape of the curve. Well, and I think it's also fun!!
EXPLORATIONS
![]()
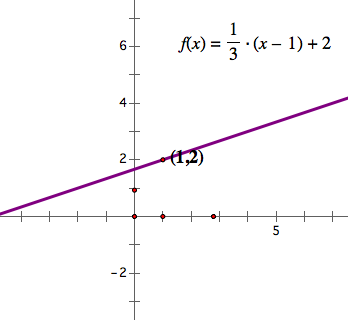
Whenever we see trigs, we always have to see with a unit circle because they are from the unit circle. Intuitively, it is just a unit circle because the x-coordinate is defined cost, and y-coordinate is defined sint (since it is on a unit circle, the radius is 1, so we can omit it.). If we want to be skeptic, then we can go through some calculations. we know that ![]() . Since x=cost, and y=sint, this gives us
. Since x=cost, and y=sint, this gives us ![]() . See the graph below.
. See the graph below.
![]() in 3D
in 3D
It is just 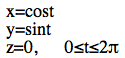 . Let's see the graph below.
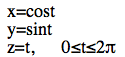
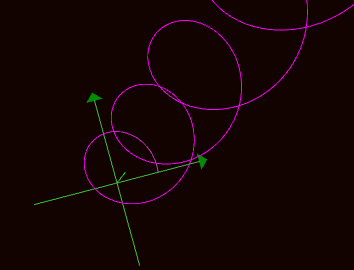
Intuitively, It will be like a spring since as t increases, so does z. Therefore, the height will be increasing as t varies. Take a look at the flash below.
Well, I got some pictures of this curve in different angles. It will help a lot to understand the curve.
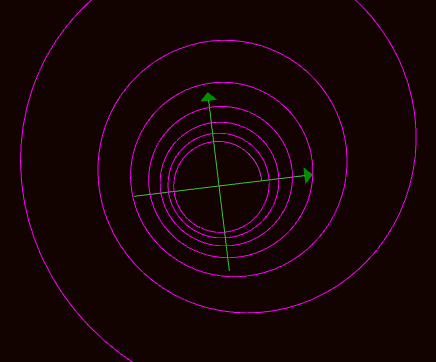
This is when we are looking down the xy-plane.
![]()
In case of ![]() , it was a unit circle. WHat is the difference between these two parametric curves? compare to the former one,
, it was a unit circle. WHat is the difference between these two parametric curves? compare to the former one, ![]() is little bit stretched, intuitively speaking. We have a circle when x= cost, and y=sint. If x=acost, it will be stretched (or shrink) by a. The same thing will happen to Y. Thus, it will be ellipse of the length of major axis a, and minor axis b. Let's see the graph. The graph is when a=3, and b=2.
is little bit stretched, intuitively speaking. We have a circle when x= cost, and y=sint. If x=acost, it will be stretched (or shrink) by a. The same thing will happen to Y. Thus, it will be ellipse of the length of major axis a, and minor axis b. Let's see the graph. The graph is when a=3, and b=2.
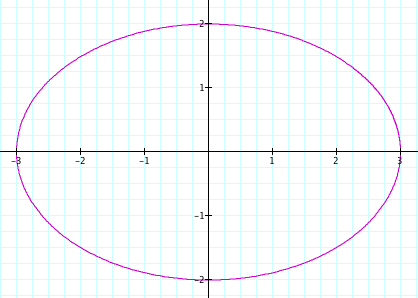
Let's prove it.
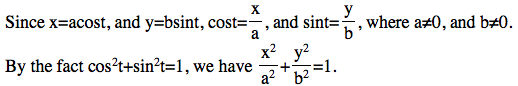
Thus, the curve is ellipse
![]()
This does not look simple because we have different variables for the parametric equation; it means ![]() will no longer work. In addition, it is much more complicated than the curve of
will no longer work. In addition, it is much more complicated than the curve of ![]() since a, and b affects the periods. Let's investigate case by case.
since a, and b affects the periods. Let's investigate case by case.
CASE1: ![]()
Orientation
Before analyzing it, I would like to point out the one thing: the orientation.
In a rectangular coordinate plane, x goes from left to right. A lot of times, we want to investigated what happens to when x grows. See the flash below.
However, the orientation of the variables differs when the trigonometry is involved. Let's figure it out on the unit circle. We always starts drawing a unit circle on the positive part of the x-axis and draw it counterclockwise.
Then, what happens to x-coordinate and y-coordinate while a point on a unit circle moving counterclockwise? Their direction is not constant; x-coordinate moves to left and then right, y-coordinate moves up and down and up. Let's take a look of the flash below.
Therefore, we can anticipate that the curve will have repeating shape depends on the the variable a and b. Moreover, all the point should be in a square of four vertices (1,1), (-1,1), (-1,-1), and (-1,1) since the range of cos(at) and sin(bt) is from -1 to 1.
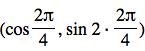
x=cost
y=sin(2t), 0≤t≤2π
By the fact that we investigate above, we can imagine how the curve looks like. While x-coordinate moving from 1→ 0→ -1→ 1, the y-coordinate moves 0→ 1→ 0→ -1 (up→down→down→up) . Meanwhile, y-coordinate repeat the same thing twice because y=sin(2t); the period reduced in half. see the table below.
t |
(x,y) |
(cost,sin2t) |
direction |
0 |
(1,0) |
(cos 0, sin 0) |
up |
down |
|||
(0,0) |
 |
down |
|
 |
up |
||
(-1,0) |
|||
 |
up |
||
(0,0) |
down |
||
down |
|||
2 |
(0,0) |
up |
Thus, it will look like a ribbon. See the graph below.
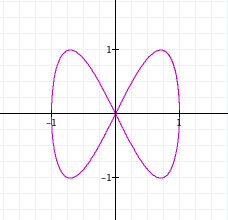
x=cost
y=sin(bt), 0≤t≤2π , b is integer
Whether b is positive or negative only affect the order of drawing graphs such as 0→ -1→ 0→ 1 (down→up→up→down) since |sint|=|sin(-t)|.
When b=2, we see two rings. This is because sin(bt) repeat the same movement twice. Then, the conclusion is easy. When b=n, we have n rings. see the table below.
| b=1 | 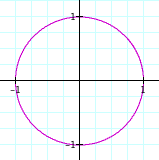 |
| b=2 | 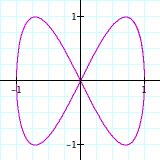 |
| b=3 | 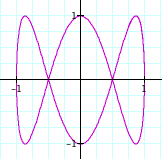 |
| b=5 | 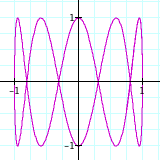 |
| b=10 | 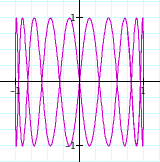 |
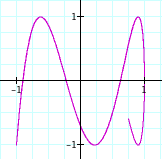
When b increases, the curves look more like a square because it repeats the same motion b times.
How about b is not an integer?
Since the period will be not be ended at the same time, it will be an open curve. The picture below is the curve of x=cost, y=sin 3.5t.