
![]() by Jiyoon Chun
by Jiyoon Chun
What is the underlying meaning of ![]() ?
?
A lot of people know that the shape of the graph ![]() , and the changes of the graph according to the value a. however, I used to remember the pattern of the graphs and did not think about the reason why the graph looks like that. Here, I want to explore the meaning of the shape of the graphs.
, and the changes of the graph according to the value a. however, I used to remember the pattern of the graphs and did not think about the reason why the graph looks like that. Here, I want to explore the meaning of the shape of the graphs.
What is ![]() ?
?
![]() . It is a product of two values; ax, and x. We can interpret
. It is a product of two values; ax, and x. We can interpret ![]() as the area of the rectangle of one side ax, and the other side is x. Then, how can we plot
as the area of the rectangle of one side ax, and the other side is x. Then, how can we plot ![]() on the y-axis depending on x?
on the y-axis depending on x?
the Rectangle of area ![]()
We already investigate how to construct ab applying Tales theorem (i.e. side splitting theorem: similarity of triangles).
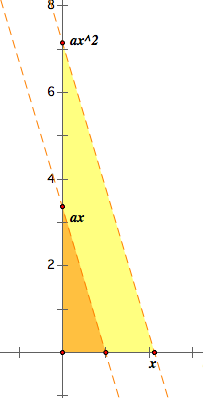
By the ratio of the similarity, 1:ax=x:y. The flash below shows the value of ![]() depends on x or a.
depends on x or a.
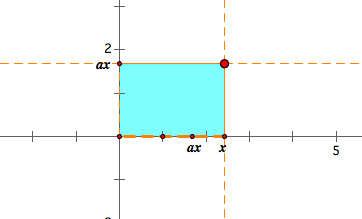
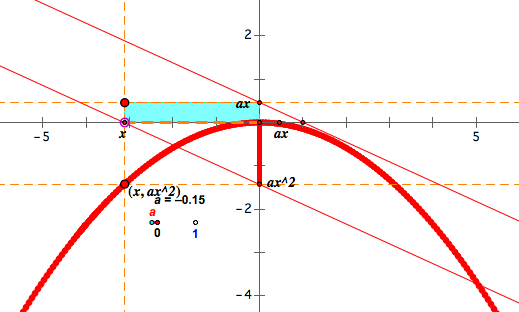
Now, in the picture below, the area of the blue rectangle is ![]() .
.
By the property of Tales theorem, we can mark ![]() on y-axis.In the picture below, we the red segment indicates
on y-axis.In the picture below, we the red segment indicates ![]() .
.
Let's see the flash below.
As we can observe in the above, the rectangle is located on either the 1st quadrant or the 3rd quadrant whereas the red segment is always above y-axis. Although both of them are indicating ![]() , why does the rectangle change its location while the red segment stays?
, why does the rectangle change its location while the red segment stays?
Orientation
All four quadrants have their orientation. If we decide the 1st quadrant to be positive, then the 2nd quadrant becomes negative since the orientation is reversed. The 3rd quadrant has positive orientation because it is the reverse of the reverse of the 1st quadrant's orientation. In this way, the 4th quadrant is negatively oriented region. Therefore, when the rectangle locates in the 1st and 3rd quadrant, we say the area is positive. When the rectangle is on either 2nd or 4th quadrant, we indicate that the area of the rectangle is negative. It makes sense in a way to consider x and ax value. When x>0, we know that ax>0 ( only when a>0), so the product of two negative numbers becomes positive. Therefore, the area is positive. The reason why the rectangle is located on the 3rd quadrant is because of x. We constructed the bottom side to be the length from 0 to x. x does not need to be always positive because it is a free point of a number line. Then, we constructed the rectangle of the bottom side x. Thus, the rectangle will be on the left side of y-axis when x is negative. We have two quadrant on the left side of y-axis. The 2nd quadrant is negatively oriented, and the 3rd quadrant is positively oriented. This is why the rectangle locates on the 3rd quadrant where x is negative.
One of the strong point of using rectangle than the red segment is that it enable us to see the relation between x and y value by showing the area whereas the red segment only indicates y value. However, the rectangle can only show the area but not the exact value of ![]() . By using both of them, we can understand more about the relation between x and y=
. By using both of them, we can understand more about the relation between x and y= ![]() .
.
Graphing by tracing a point
In ![]() , x is independent variable, and y is dependent variable. Thus, If we trace y value according to x value, we can get other graph.
, x is independent variable, and y is dependent variable. Thus, If we trace y value according to x value, we can get other graph.
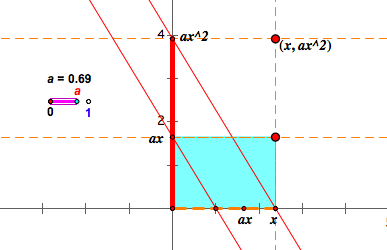
a>0
The graph is above the x-axis since it is always positive. See the left side of the y-axis. The rectangle is located on the positively oriented plane, and the red segment is above the y-axis. These two facts match the graph.
a<0
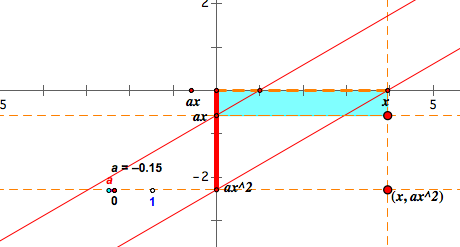
When x>0 and a<0, then the bottom side length is positive and the height ax is negative. Therefore, the area of the rectangle is negative. This is why the red segment is below x-axis. The graph will be concave down, and the rectangles are either the 2nd or the 4th quadrant.
a=0
Then the area of the rectangle will be 0 because the height of the rectangle will be 0. Therefore, y=0.
The shape of graphs when a varies
Through the previous graphs, we know that the sign of a decides the shape of the graph: concave up or concave down. Now, I want to investigate how |a| affects the shape of the graphs. See the picture.
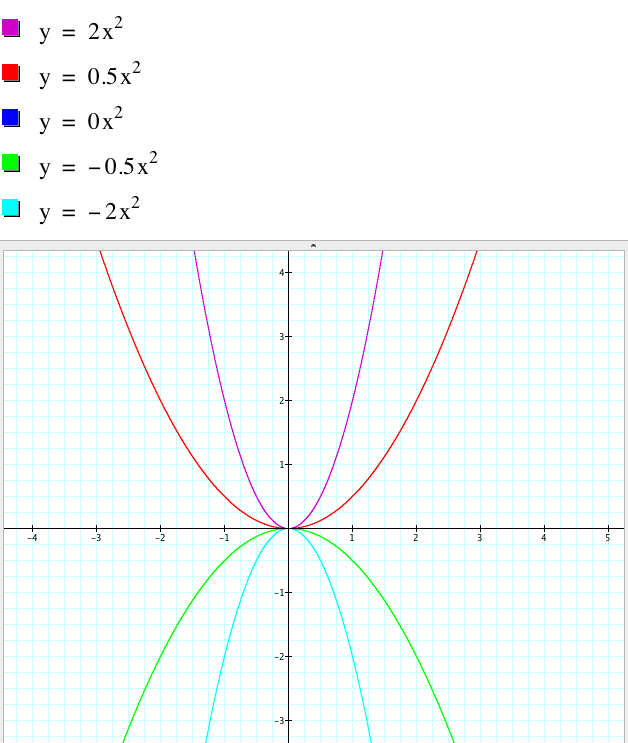
Let's think about the rectangles of dimension x and ax. For the fixed x, ax varies according to a. The larger |a| is, the bigger the height of the rectangle we have. As a result, the area increases, so does ![]() . Therefore we have narrower graphs when |a| increases.
. Therefore we have narrower graphs when |a| increases.