EXPLORING QUADRATIC FUNCTIONS
BY: ERICA FLETCHER
In mathematics, a quadratic equation is a polynomial
equation of the second degree. The general form is ![]() , where x represents a variable and a, b, and c are coefficients where a cannot be equal to 0. For this assignment we will look at quadratic
equations of the form
, where x represents a variable and a, b, and c are coefficients where a cannot be equal to 0. For this assignment we will look at quadratic
equations of the form ![]() and vary values of a, b, and c while keeping the other two constant.
and vary values of a, b, and c while keeping the other two constant.
Firstly, we will explore the constant term or what some refer to as the free term. What happens when we vary c separately and fix the quadratic at a = 1 and b = 2?


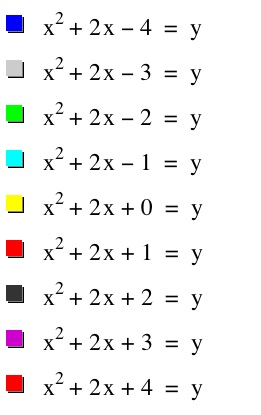
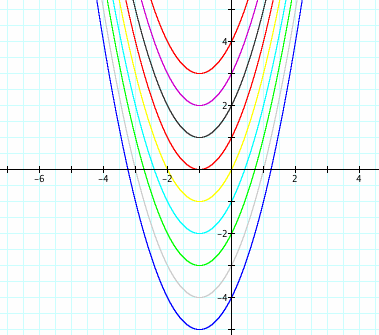
We shall evaluate how the c-value affects the graph. It is my first assumption that since the c-value is also our y intercept that it will not affect the shape of the parabola. We will look to fix the variables at a=1 and b=2 and attempt to generalize a rule for how the graph behaves as we vary the values of c. The following set of graphs shows different values of c:
We begin to notice that changing the value of the constant in a quadratic function causes the graph to shift vertically. If we look at the yellow graph where c = 0. Here the y-intercept is located at the origin. As the value of c varies; the y-intercept changes as well. This causes the graph to shift up or down vertically. If we think about this mathematically when we change the value of c, we are either adding or subtracting some constant value to y. This value that is added or subtracted shifts every value of y vertically based on what value of c we are adding or subtracting to the rest of the function. We observe that when c is positive the graph moves up but when c is negative the graph moves down. Changing the value of c is what we call a vertical translation or vertical shift.
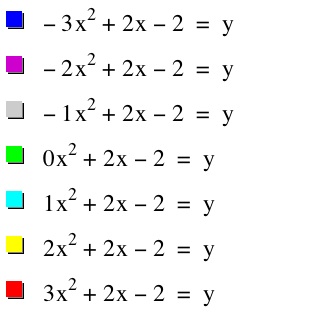
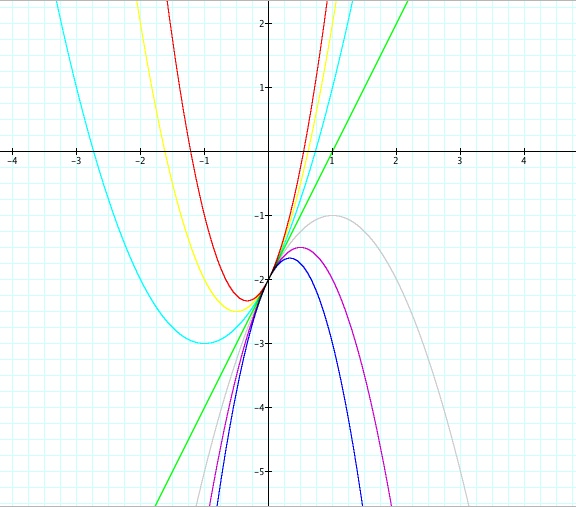
As we explore quadratic functions we notice that the position, width, and orientation of a particular parabola will depend upon the values of a, b, and c. However, we wonder what happens when we vary the value of b. We will look at different values of b even when a=0. We know when a = 0 that our quadratic equation becomes a linear function so we will only focus on values of a such that a > 0 and a < 0.
We notice that when a is positive, the graph opens upward. However, when a is negative, the graph opens downward.
Also when a > 1 we notice there is a vertical stretch and when a < 1 we notice a shrink (vertical compression).

