
Quadratic and Cubic Equations
Assignment 3
by Caralena Luthi
In this assignment we are looking at the quadratic equation in terms of the xb plane. We use the following equation to start with:
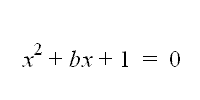
We are experimenting what would happen to the equation and graph if we
change the b value from 5 to -5. We begin to notice that the
graph has a hyberloic tendency. We also find that the equation
will provide 2 roots, one positive and one negative, or there will not
be any roots. To use the graphing calucator program we will use
the following equation:
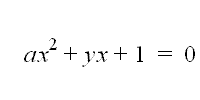
Using the y value, we can change the
value from 5 to -5. We notice that when y is less than 2 but
greater than -2 that we have no roots. This can be seen in the
graph below.
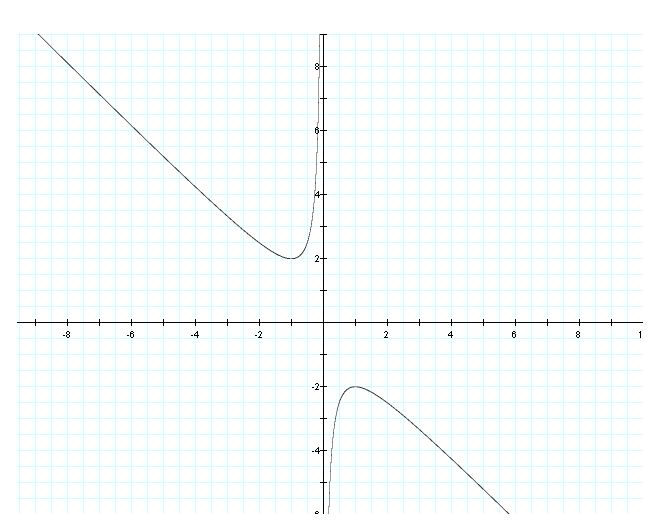
We can prove that we have two vertices on this graph at (-1, 2) and (1, -2) by solving the equation when y = 2 or -2. When you solve for the x value you find that there is only one solution for each section of the graph. x = 1 or -1.
We can prove that we have two vertices on this graph at (-1, 2) and (1, -2) by solving the equation when y = 2 or -2. When you solve for the x value you find that there is only one solution for each section of the graph. x = 1 or -1.
Using the Graphing calculator program we
can trace the y values from 5 to -5 and visual we can see the roots
being traced.
Next we can change the equation to where c = -1 instead of 1. This will change the hyberolic direction. We will see this new graph flip over the y-axis and become wider.
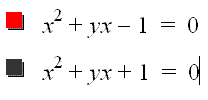
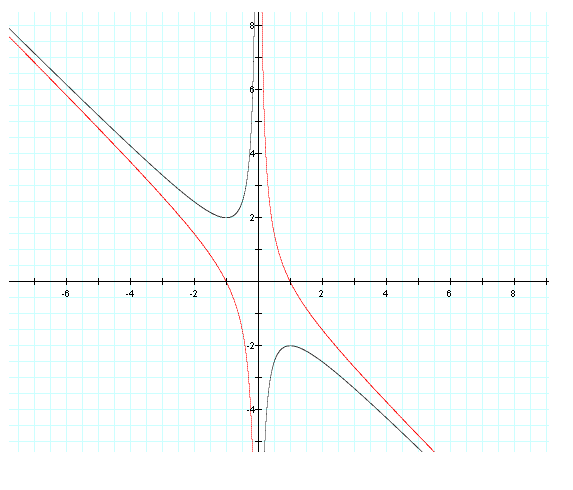
Next we can change the equation to where c = -1 instead of 1. This will change the hyberolic direction. We will see this new graph flip over the y-axis and become wider.
When we changed the c value to -1 we
also see that we will have always 2 roots, one positive and one
negative. The original graph once again lacks roots when y is
less than 2 but greater than -2.
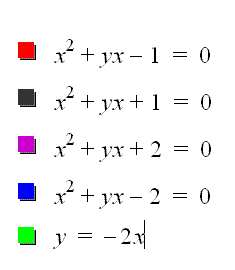

We know that the vertices of the black graph are (-1, 2) and (1, -2). The green graph represents the linear equation of y = -2x. This linear equation cuts through the graph and is bisecting the graph and acting as a midpoint between the two roots on either side.
We know that the vertices of the black graph are (-1, 2) and (1, -2). The green graph represents the linear equation of y = -2x. This linear equation cuts through the graph and is bisecting the graph and acting as a midpoint between the two roots on either side.