
Linear Functions
By Leighton McIntyre
Goal : To examine the sum, product, quotient and composition of linear functions.
ASSIGNMENT 1
Linear functions are functions of the form y = mx + b. The graph of a linear function is a straight line. In the equation y= mx + b, m represents the slope of the line and b represents the y-intercept. For example the function y = 3x + 1, has a slope of 3 and a y-intercept of 1.
For the linear functions f(x) and g(x) in the question 2 of assignment 1, let the f(x) and g(x) be linear functions under the following conditions
1) the slope of one function is positive and the slope of the other is negative
2) both functions have negative slopes
3) both functions have positive slopes
4) the slopes of the functions are perpendicular
5) the slopes of the functions are parallel
CASE 1: The slope of one function is positive and the slope of the other is negative
Sum of linear functions
Let f(x) be the function y = 3x + 1 and g(x) be the function y = -2x + 1. The two functions were summed and their graphs are shown below. Note that the sum of the original results in a third function which is also linear since the coefficients of the slopes are added together and the constants are added together.
We choose two linear functions f(x) and g(x), represented by equations y=3x+1 and y = -2x+1, and then found the sum y=(3x+1) + (-2x+1) of the graphs.
Note that the slope of the first line was positive and the second line was negative. The slope of the combine line was the sum of the slopes of the first two lines.
Graph 1 : the sum of f(x) and g(x)
Product of Linear Functions
The slopes of the lines are still positive and negative respectively. When multiplied the product becomes a quadratic such that the shape becomes a curve looks like a parabola. The coefficients of the slopes are multiplied together as well as by the constant terms. When the x's are multiplied together we get a term in x squared that changes the shape to that of a parabola. The parabola crosses the x-axis at the points -1/3 and 1/2.
Graph 2: the product of f(x) and g(x).
Quotient of Linear Functions
The graphs of the first two equations are divided and the new shape is that of a hyperbola. Notice that the vertical asymptotes of this hyperbola tend towards x=1/2 which is the root of g(x) and the horizontal asymptotes tend towards -1.5 which is the quotient of the slopes of f(x)/g(x).
Graph 3: Quotient of f(x) and g(x)
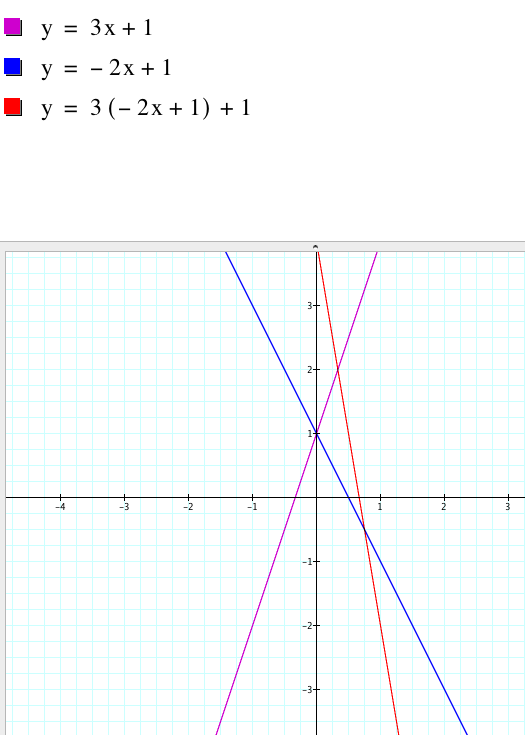
The composition function f(g(x)) is taken and the new graph looks like a line, but the slope is negative.This is because the product of the slopes is negative.
CASE 2 : Both functions have negative slopes
The first graph shows negatively sloping lines that is the sum of the slopes of the functions is negative. The second graph shows a parabola that slopes upward because the two negative coefficients of the slopes multiplied make a positive number. The third graph shows a hyperbola with curves in the top right and bottom left quadrants. The vertical asymptote is at x=1/2 which is the root of g(x) and the horizontal asymptotes tend towards 1.5 which is the quotient of the slopes of f(x)/g(x). In the fourth graph the resulting composite function is a straight line, but notice it has a positive slope because the negative coefficients multiply to give positive coefficient.
CASE 3: Both functions have positive slopes
We now try with two linear equations with positive slopes. Notice that in the first graph the slope of the combined addition slope is still positive. In the second graph the product the shape is a parabola and the points where the parabola crosses the x axis are the roots of f(x) and g(x). For the quotient the result is a straight line because the slopes and constant terms of f(x) and g(x) are direct multiples of each other. The composition function is a straight line parallel to f(x).
CASE 4: The slopes of the functions are perpendicular
We will now examine two functions which are perpendicular to each other.
Notice now that the sum of the functions is a horizontal line. This is because the coefficients of the slopes cancel out each other when they are added together and we are left with a constant in y.
Finally we examine the cases where the two linear functions f(x) and g(x) are parallel. We now see that in the purple graph the resulting sum function is a line whose slope is the sum of the slope coefficients of f(x) and g(x). The green graph is a parabola which curves upwards because the product of the coefficients of f(x) and g(x) is positive. THe parabola has roots at the roots of f(x) and g(x). The light blue graph which represents is a hyperbola with the vertical asymptotes at x = -2 which is the root of g(x) and the horizontal asymptotes at y = 1 which is the quotient of the slopes of f(x) and g(x).
Summary
Adding Linear functions
We notice that when we add linear functions we get a function whose slope is the same of the coefficients of the two original functions and whose intercept is the sum of the intercepts of the original functions. Suppose for example, we had two functions f(x) = ax + b and g(x) = cx + d. The sum of the functions; f(x) + g(x) = (ax + b) + (cx + d) = ax + cx + b + d = (a + c)x + (b+d). Because the slope is the sum of a and c, if a = -c then the sum of the functions is a horizontal line. The sum however cannot result in a vertical line because f(x) and g(x) are functions.
Product of Linear Functions
When we multiply linear functions we get a parabola which opens up if the product of the slope coefficients of the original linear functions is positive. The parabola opens downwards if the product of the slope coefficients of the original functions is negative. The parabola crosses the x- axis at the roots of f(x) and g(x). Given the two functions f(x) = ax + b and g(x) = cx + d, then the product of the functions; f(x) * g(x) = (ax + b) * (cx + d) = ax*cx + ax*d + b*cx + b*d = (ac)![]() + (ad + bc)x + bd. Note here that the resulting product is a quadratic function which takes the shape of a parabola.
+ (ad + bc)x + bd. Note here that the resulting product is a quadratic function which takes the shape of a parabola.
Quotient of Linear functions
When we divide linear functions we get a hyperbola which has asymptotes is the root of g(x) an the horizontal asymptotes is the horizontal asymptotes are the quotient of f(x) and g(x). In the special case where the two functions are constant multiples of each other, the resulting quotient is a straight line. Given the two functions f(x) = ax + b and g(x) = cx + d, then the quotient of the functions; f(x) / g(x) = (ax + b) / (cx + d). There is one point that the domain is not defined and that is where the denominator cx+d equals zero, or where x = -d/c. This line becomes the vertical asymptote of the graph. There is also a point that the range is not defined, that is the point y = a/c or the horizontal asymptote of the graph. The asymptotes can be further seen as we take look at the behavior of y as x gets extremely large. The quotient (ax + b) / (cx + d) can be broken down to ax / (cx + d) + b/ (cx + d) so when x gets really big (tends to infinity) then we have a times something really big over c times something really big which gives the asymptote to be the line y = a/c, since the b over something really big tends to zero. The same argument holds for when x gets extremely small the asymptote again is a/c.
Composition of functions.
The composition of the functions results in a linear function which has slope the product of the slope coefficients of f(x) and g(x) and which has y intercept of f(x) times the y intercept of g(x) plus the y-intercept of f(x). Given the two functions f(x) = ax + b and g(x) = cx + d, then the composition of the functions; f(g(x) = (a(cx + d) + b) = acx + ad + b. This is a linear function with slope acx and y-intercept ad + b.