
by Brent Robertson
Trigonometry is introduced to American students at about the age of 14 to 15. Generally, the right triangle is given with the requisite sides defined, such as:
An acute angles trig functions are defined using the ubiquitous SOCAHTOA- Sine of an angle is the ratio of Opposite side to the Hypotenuse side, Cosine of an angle is defined as the ratio of the Adjacent side to the Hypotenuse side, and the Tangent of an angle is defined as the ratio of the Opposite side to the Adjacent side. How can technology help us to understand some of these concepts in other ways?
Let's start with the tangent. Students often wonder if there is any connection to the tangent line to a circle. Here is how technology can illustrate these points. Click on the image below to watch a you tube demonstration:
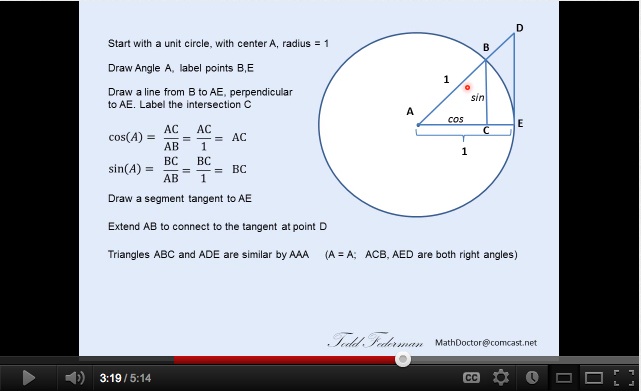 http://www.youtube.com/watch?v=6-tsSJx-P18
A great deal of functionality and discovery is possible with the Graphing Calculator Program available as standard equipment on Apple products. An advantage of this program over a typical graphing calculator from a Texas Instruments stable, is the ability to graph relations, the multiple graphs simultaneously, and the dynamic property of the graphs. For example here is the graph of y=tan(x-n) with n changing from negative five to positive five. The student can see that this is a horizontal translation in the positive direction. This is consistent with other functional horizontal translations with minus n being the so called minus "h".
Here is the famous period shift parameter on the parent function y=tanx or with the transformation ![]() . I've used n between -2 and +2 with smaller increments of change. A larger number will pull the tan (stretch it) but also shrink the period. Generally a tan function will have a period of pi radians (180), A value less that one but greater than zero will have the effect of "compressing the tan and extending the length of its period during one cycle. I like this demonstration.
. I've used n between -2 and +2 with smaller increments of change. A larger number will pull the tan (stretch it) but also shrink the period. Generally a tan function will have a period of pi radians (180), A value less that one but greater than zero will have the effect of "compressing the tan and extending the length of its period during one cycle. I like this demonstration.
As n gets closer and closer to zero, the period of tan gets longer and longer, kind of counter intuitive to what you might expect, however, as many students have seen with other families of mathematical functions, if the variable is part of the function, which in this case the n isw intertwined with the tanx then it haqs the opposite effect. Larger n's make the period get SMALLER!!.
Upon reaching the negative value, the reflection effect is present as the tan appears to turn over. This is due to the coterminal angles being reflected on the unit circle. For example, Using the tangent of pi over four radians (45 degrees) you would get a value of one. When you make n=-1, your coterminal angle goes from the first to the fourth quadrant and the tan value reflects as well to negative one. This visual representation oft he change of phase is extremely valuable to students just beginning to explore the possibilities of the unit circle.
Here is a great example of the last tangent translation using the amplitide shift. y=ntanx. I'll go back to an n value between -5 and 5.
More parameters can be added, but only one at a time can be dynamic. This might be a good thing because if you have too much going on, you could get a bit overwelmed. However, looking at this next sin graph you can see how it is informative to be able to add other constants into the equation. This sin graph has the y=sinnx period shift, but we've added a constant of plus five to the very end of the function. Seeing the result, and based on experience with other mathematical functions, a student will see that the five represents a vertical tranlation to the parent function. The dynamically changin n continues to change the period of the function but in concert with the vertical shift.
OR FOR EXAMPLE WE COULD adjust the amplitude with a constant of one-half in the sin function making the period longer. Remember it has the opposite effect.