Graph:
By Alicia Rosenberger
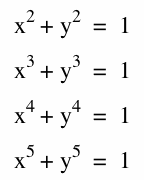
Consider the graphs,


Let's take a look at the pink graph and the red graph above.
The pink graph will represent the general trend of the graphs with even exponents, while the red graph will represent the general trend of the graphs with odd exponents.
We notice that the pink graph is a circle. We can see that this is a true representation of the equation by checking some of the points: x2=1-y2 By re-writing the equation, we see that when x=0, y=1 or y=-1, and when x=1 or x=-1, y=0. But let's say we choose a value for x greater than 1, for example x=2. We know that x2=4, but that would mean 1-y2=4, which could only be possible if y2=-3. However, since a number raised to an even power can never be negative, we know that our pink graph is restricted to the values -1 ≤ x ≤ 1 and -1 ≤ y ≤ 1.
Now, the red graph, although it is a similar equation, does not create a closed shape. This graph is closer to a line with a rounded portion, or a wave.
We can try and see what the pink and red graphs have in common by looking at the equations. Recall the first equation, x2+y2=1, and now look at the second equation, x3+y3=1.
What do the two equations have in common?
Both equations are equal to 1 and both equations are the sum of two variables which have been raised to the same power. The equations are different because one equation raises its variables to an even power and the other equation raises its variables to an odd power.
We can see now that the significant difference between these two equations is the value of the exponent. So, let’s see what happens when a number is cubed (or raised to an odd power). If we let x=2, then x3=8. Recall that if a negative number is squared the result will always be a positive number: so when x=-2, (-2)2=(-2)(-2)=4. However, (-2)3=(-2)(-2)(-2)=-8. This means that the red graph will not be restricted like the pink graph was.
Taking a closer look at the red graph, x3=1-y3. We immediately can see a difference from the first equation: When x=0, y=1 and when x=1, y=0, however when x=-1, y3=2 and when y=-1, x3=2. Unlike in the first equation (the pink graph), it is possible in the second equation (red graph) to find a number whose cube is 2 or -2. Therefore the red graph is not restricted like the pink graph is.
More generally, we notice that for odd values of n, the extremes of the domain of x values generates a graph asymptotic to the line y= -x. Whereas for even values of n, the domain of x is restricted to values of -1 ≤ x ≤ 1. Each value of x will have two values of y.
Exploration
what do you expect for the graph of:


Based on the discussion, we can predict what will happen to the graphs of x24+ y24= 1 and x25+ y25=1:
x24+ y24= 1:
First notice that since 24 is an even number, the domain of x will be restricted to values of x from -1 to 1. Therefore the graph of x24+ y24= 1 should be a closed shape which is restricted to the values -1 ≤ x ≤ 1 and -1 ≤ y ≤ 1. Although its graph will be similar to the pink and dark blue graphs, the corners of the shape will be more pronounced, like it is approaching (but will never reach) a square shape, because it is approaching the limit.
x25+ y25=1:
We see that since 25 is an odd number, the extremes of the domain of x values will generate a graph asymptotic to the line y= -x. Therefore the graph of x25+ y25=1 should be a line with a curved portion, like the red and green graphs. However, the curved portion of the line in this graph will become more rigid or angular, like it is approaching (but will never reach) a square corner, which is the limit.
