
Assignment 2: Examining Graphs of Parabolas
By:
Jonathan Sabo
Examine graphs for the parabola

for different values of a, b, and c. (a, b, c can be any rational numbers).
Try using the GC 3.5 animation by replacing a, b, or c with an n and selecting an appropriate range for n
First we graph the parabola where a, b, and c are all equal to 1.
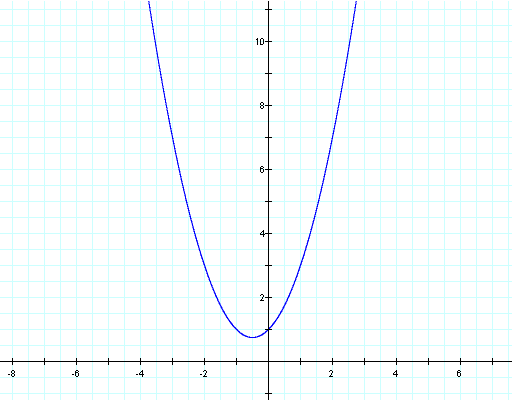
We
can see the vertex at (-1,1.5) and the graph has a line of symmetry at
x = -1. Lets observe what happens as we vary a, b, and c.
Observe as we vary a.
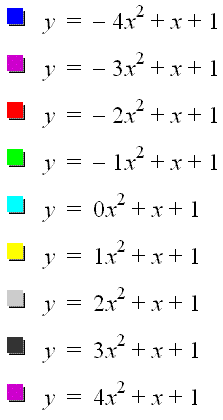
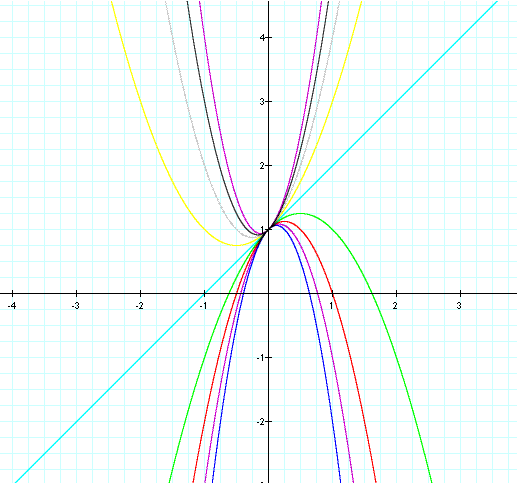
The first thing that I notice is the result from putting a negative sign in front of the function. Everyting there is a negative sign in front the parabola is reflected. The next thing that I notice is as |a| increases the parabola is being stretched vertically. All of the graphs seem to be tangent to the line y = x + 1.
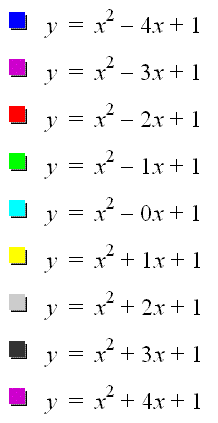
Observe as we vary b,
Observe as we vary a.


The first thing that I notice is the result from putting a negative sign in front of the function. Everyting there is a negative sign in front the parabola is reflected. The next thing that I notice is as |a| increases the parabola is being stretched vertically. All of the graphs seem to be tangent to the line y = x + 1.
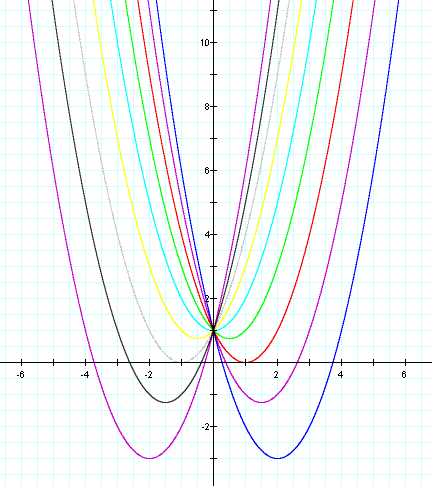
Observe as we vary b,


From this graph we notice that as b approaches -4 the graph will shift down and to the right. We also notice that as b approaches +4 the graph will shift down and to the left.
Observe as we vary c,
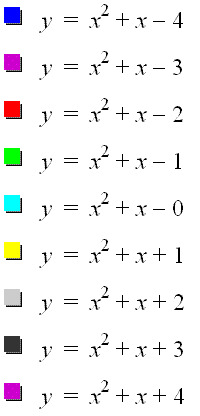
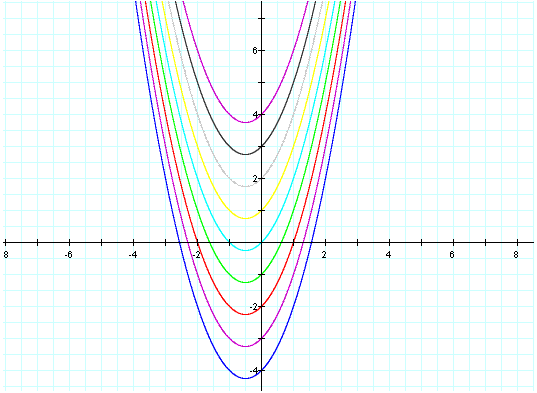
From this graph we notice that as c decreases the graph will shift down and as c increases the graph will shift up.
What exactly is happening as we vary a,b, and c?
As B increases > 0
- The graph will move to the left

- The graph will move down

- The graph will move to the right

- The graph will move down

- The graph will shift up by C.
- The graph will shift down by C.
- The parabola will open upwards.
- The graph will continue to become more narrow.
- The parabola will open downwards.
- The graph will continue to become more narrow.
Back to Home Page