Assignment 3: Graphing in the xb Plane
By:
Jonathan Sabo
Graphs in the xb plane.
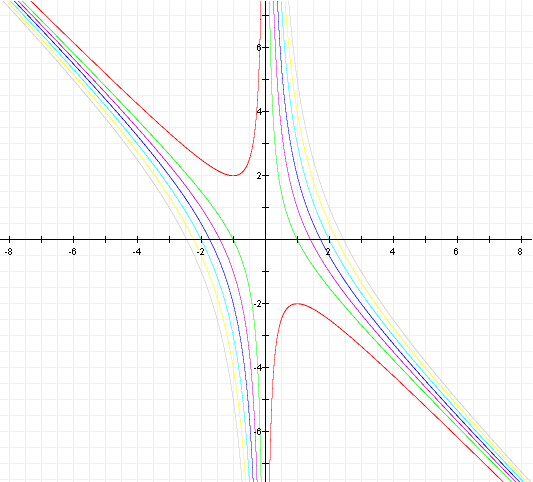
Consider again the equation
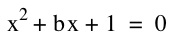
Now graph this relation in the xb plane. We
get the following graph.
In order to graph this equation in the software we must plug in y instead of b.
Observe,
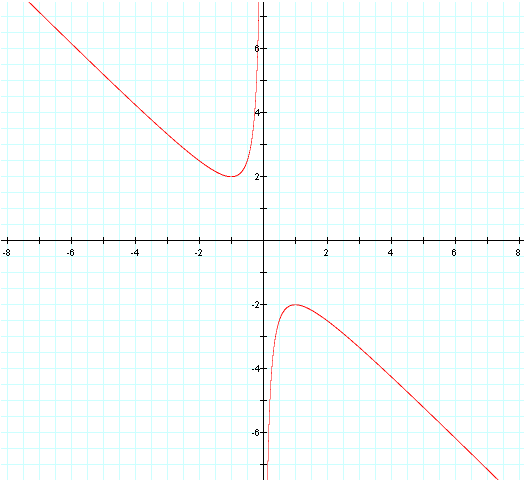
If we take any particular value of b, say
b = 5, and overlay this equation on the graph we add a line parallel
to the x-axis. If it intersects the curve in the xb plane the
intersection points correspond to the roots of the original equation
for that value of b. We have the following graph.
In order to graph this equation in the software we must plug in y instead of b.
Observe,
For each value of b we select, we get a horizontal
line. It is clear on a single graph that we get two negative
real roots of the original equation when b > 2, one negative
real root when b = 2, no real roots for -2 < b < 2, One
positive real root when b = -2, and two positive real roots when
b < -2.
Consider the case when c = - 1 rather than + 1.
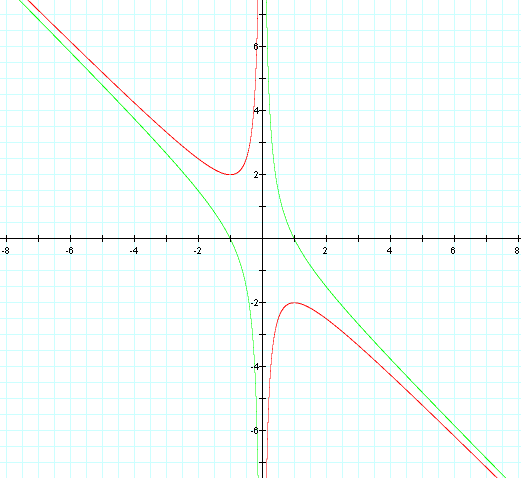
Consider the case when c = - 1 rather than + 1.
Observe,
in this graph we see that there are 2 real roots when c is less than 1.
Lets observe several other cases where c is less than 1.