
The
Study of the Fibonnaci Sequence and Phi
By: Amanda Sawyer
In this
assignment, we will study different properties of the Fibonnaci Sequence. This sequence has the first two terms
equaling one, and then the next terms are generated by:
![]()
|
|
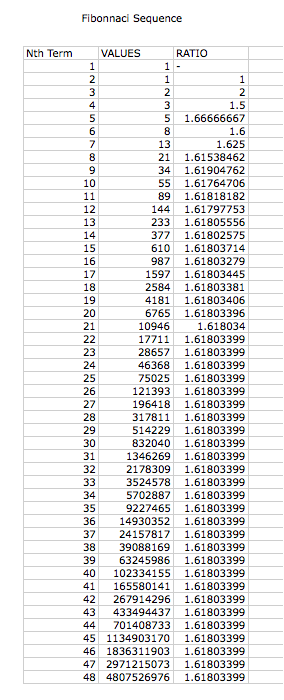
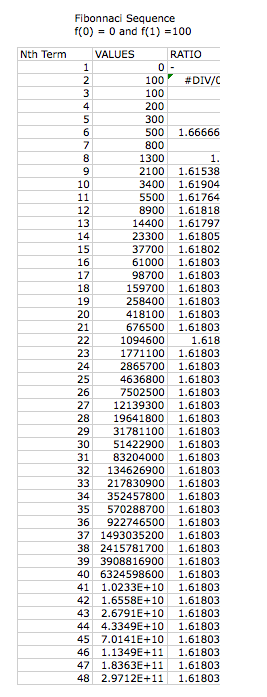
We can
view this sequence using an Excel Spread Sheet, as seen in the figure
above. We can see that the ratio
of each pair of adjacent terms in the Fibonnaci sequences becomes closer to a
given value the larger the nth term becomes. This value is known as phi.
What is Phi?
There is a recursive relationship between each of the two values in the Fibonnaci Sequences ration. This relationship can be shown by the values:
![]()
Let’s determine how we can evaluate this term ![]() . For some
arbitrary large value of n, we know that:
. For some
arbitrary large value of n, we know that:
![]()
Therefore, we can redefine this ratio as:
![]()
This fraction separates into the following value:
![]()
We know see that phi is equal to one plus one over phi. This allows us to find the exact value of this term.

We see that we started by multiplying phi on both sides of our equation. This created a quadratic equation that we were able to solve using the quadratic formula. From this information, we can see phi has the value of:
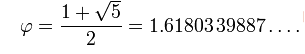
Phi is an irrational number that is found in nature, music, art, and many other places. This value is also know has the golden ratio or the golden mean. To find out more about this number, please view the video below.

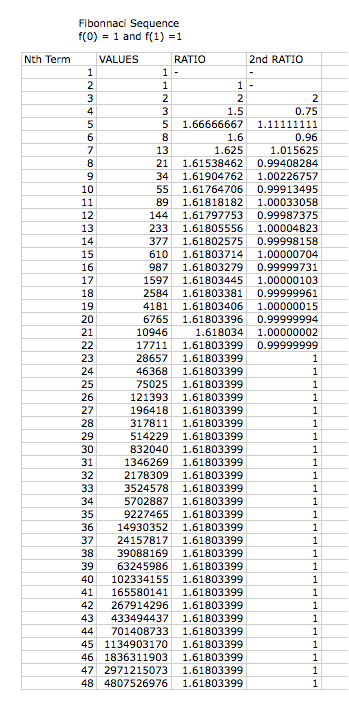
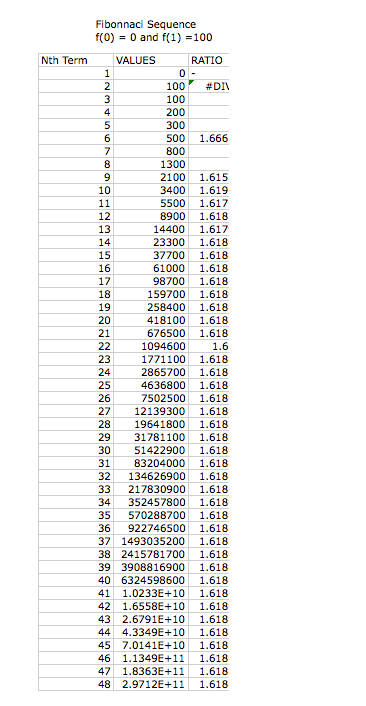
What will happen if we change the
beginning terms in the Fibonnaci Sequence?
We can now investigate what happens when the first two terms are changed from one. Below, we have three different examples of the Fibonnaci sequence with differing beginning values.
|
|
|
|
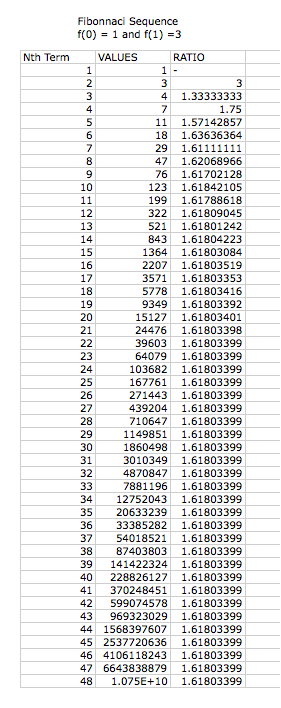
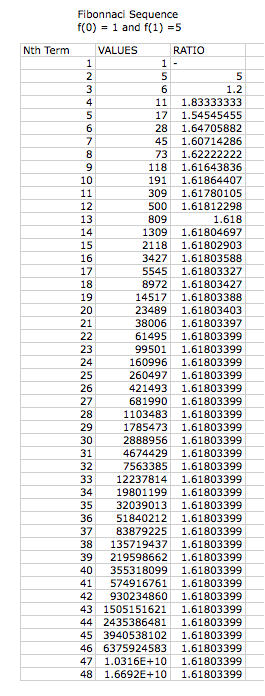
Again we notice that the larger the nth value, the closer the ratio becomes to the irrational value of phi. We again can understand this relationship because the first two values are the summation of the previous values. This is how we created phi, thus the ratio will be consistent with phi for any given values of f(0) and f(1).

What will happen if we take a
second ration?
Next, let’s study what will happen if we take a second ration between two values. In the table below, we have three different beginning sequences for our recursive relationship.
|
|
|
|
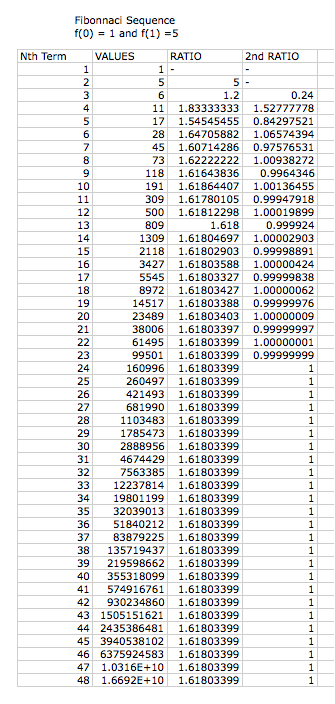
Notice that the larger then n value becomes, the closer the second ratio becomes one. We know that this is true because each of the first ratios approach the value of phi. Through this Excel Spread Sheet we were able to observe this relationship and clearly see what happens with large values of n.