
Parametric Equations
By:
Amanda Sawyer
In this assignment, we are asked to
investigate each of the following equations from 0 to 2 pi and describe each of
the following when A = B, A < B, and A > B.
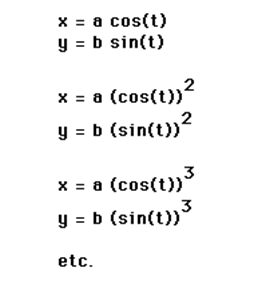
Let’s consider each of the three
situations A) when A = B, B) when A < B and C) when A > B.
A) When
A = B
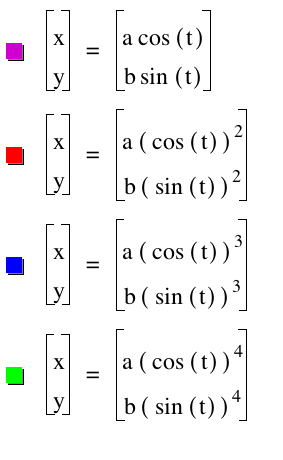
Let’s consider the case when A = B and investigate what happens. Let’s study the following equations and the graphs with the following colors.
To
investigate this behavior, let’s look at the graphs of the above
equations. We will study the effects of
the graph when the value of A=B is one, two, four and sixteen.
|
VALUE
of A=B |
GRAPH |
|
A=B=1 |
|
|
A=B=2 |
|
|
A=B=4 |
|
|
A=B=16 |
|
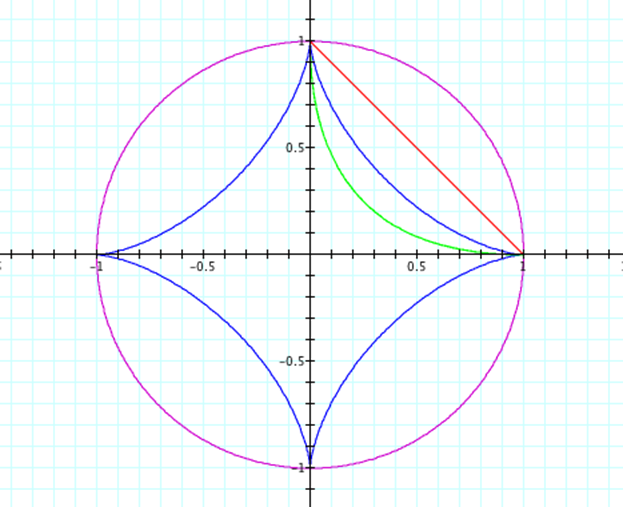
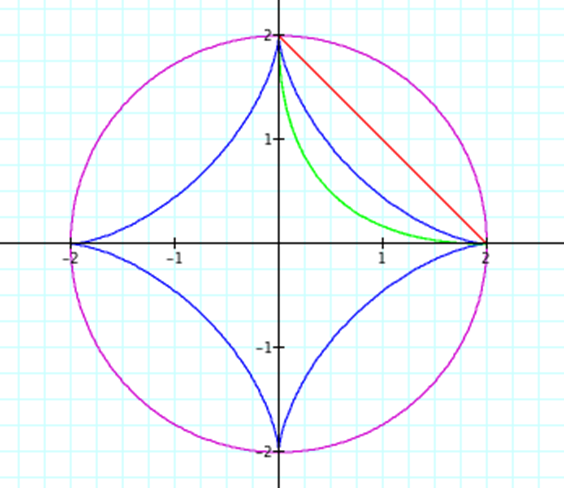
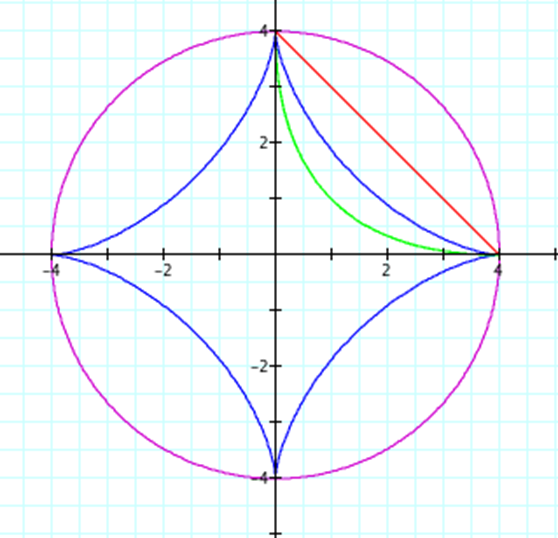
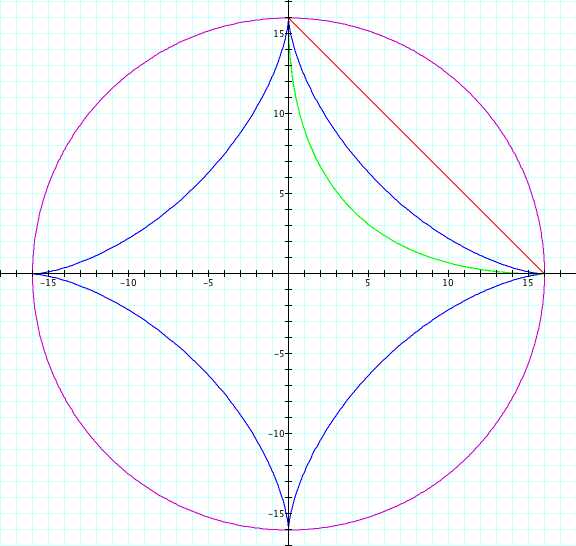
We
can see from the following pictures that the shape of the graph does not change
when the value of A=B changes, rather the distance each shape is on the x and y
axis changes to the selected value of A=B.
Therefore, we have shown that the value of the distance on the x and y
axis is dependent on the value of A and B. Also, the parametric equations with even
exponents always are located in the first quadrant while the parametric
equations with odd exponents complete the circuit and exist in all four
quadrants.
B) When
A > B
Next
let’s consider what happens when A > B. For the following graphs, we will keep the
same four equations and colors of the graphs as above. Let’s investigate the behavior of each of the
graphs when the values of A and B are A=1
and B
= 1.5, A=1 and B =2, A=1 and B
= 4, A=1
and B=16.
|
VALUE
of A=B |
GRAPH |
|
A=1
and B =1.5 |
|
|
A=1
and B=2 |
|
|
A=1
and B= 4 |
|
|
A=1
and B=16 |
|
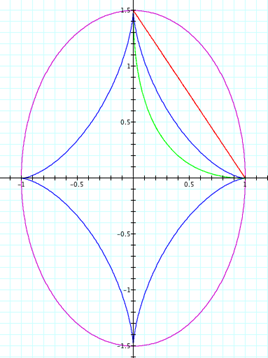
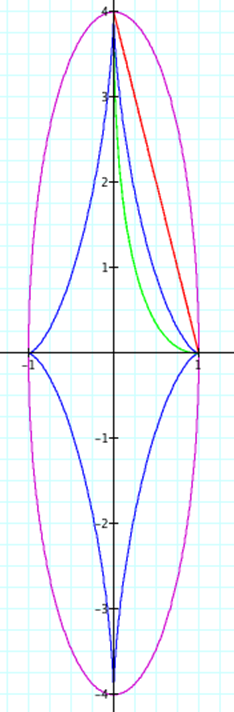
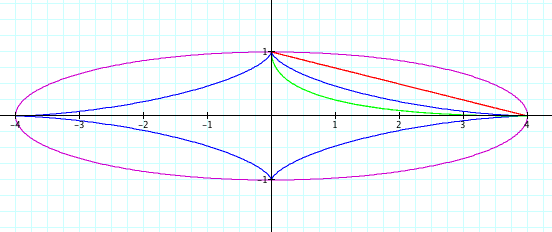
This
time our shape did change, but it is clear that that the A value represents the
solution on the x axis and the B value represents a solution on the
y axis. For example when we set A=1
and B
=4, this shows us that (1,0) is a solution for all
four equations and (0,4) is a solution for all four equations. It also gives us the relative maximum values
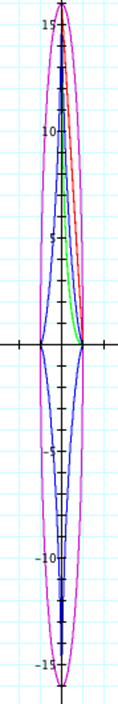
for all four equations. For example in
the case where A= 1 and B = 16, the relative maximum value
of each equation on the domain was at (1,0) and the
relative maximum value on the range was at (0,16). Continually, the parametric
equations with even exponents remain in the first quadrant while the parametric
equations with odd exponents complete the circuit and exist in all four
quadrants.
C) When
A > B
Our
final case that we would like to study is when A > B. Again, let us keep the same four equations
with the same colored graphs for each of our pictures. Let’s consider the case when A=1.5
and B=1,
A=2
and B=1,
A=
4 and B= 1, and A=16 and B = 1.
|
VALUE
of A=B |
GRAPH |
|
B=1
and A =1.5 |
|
|
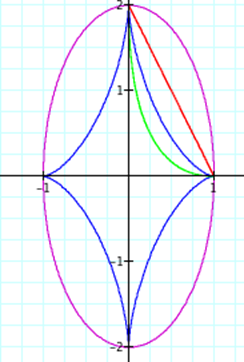
B=1
and A=2 |
|
|
B=1
and A= 4 |
|
|
B=1
and A=16 |
|
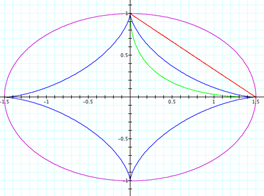
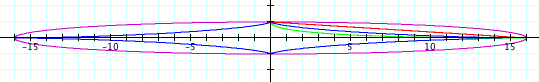
As
one might expect, similar things continue to happen. Like we say in the case
where A < B, we can clearly see now that the A value does effect the x
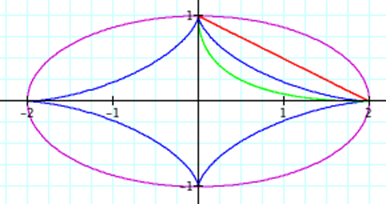
coordinates and the B value effects the y coordinates. For example when A=2 and B=1,
we see a maximum x-value of each of the four equations is at (2,0) and the maximum y-values of each of the four equations
is at (0,1). As we expect, the
parametric equations with even exponents remain in the first quadrant while the
parametric equations with odd exponents complete the circuit and exist in all
four quadrants.
Through
the use of Graphing Calculator, these properties are easy to observe, and it
allows us to make obvious generalizations about the properties of these
trigonometric functions.