Web Source Analysis
PQRS & *Linear Regression Calc
*(Shock wave is needed for Linear Regression Calc)
Statistics 6070
Ryan Shannon
Summary and analysis of web source or software programs
The above photos are links to respective webpage containing these programs
Click here to view as word document
http://members.home.nl/sytse.knypstra/PQRS/
(Probabilities, Quantiles and Random Samples)
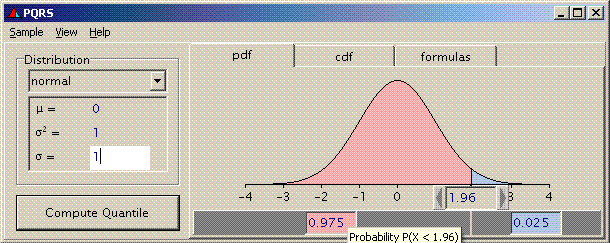
PQRS is a tool for calculating probabilities and quantiles associated with a large number of probability distributions. In addition, random samples can be drawn and stored to a file. Quantiles and probabilities are displayed and edited in their natural position relative to the probability (density) graph. This makes PQRS very easy to use. (http://members.home.nl/sytse.knypstra/PQRS/)
The strengths of the PQRS: This is a great display of both a probability density function and a display of a cumulative density function graph. Being a visual learning I feel that allowing students to be able to make their own graphs will greatly improve their understanding in constructing these graphs. I like that this program makes it very clear to be able to see where values fall directly on the density curve. We can find the left, right, and value probability for the graph too.
We can see in both English and Greek letters mean, standard deviation and variance. This component is great for up coming students to be able to locate these points on a curve. To see how mean and median vary when a graph is skewed. Lastly, but most important this program also labels the formulas on how to find the labeled points on the graph. Students can not only just see the mean but also find it them selves, a win-win program. This program can make printing no longer a bother as the program is free so any student can download this onto their computer and save it for better understanding without a giant stack of papers from class. This was the programs original function.
The weakness of PQRS: For beginning level and high school statistics I don’t see many weaknesses to this program. The file to download is a little large and that may cause a few issues. Free programs do tend to have bugs and difficult to navigate, but I saw no major issues yet. The program is better for a windows computer than a Mac.
This Program would be used in the multiple places of the curriculum I would use mostly for mean versus median. And probability of a density function,such that, Given that we picked a man from a group what is the likelihood he will be below 74 inches tall given….etc. From here I would require the students to find a probability such as picking marbles or M and M’s as they’re easier to find now. Ask them to create the likelihood of picking a red one given certain parameters.
http://www.roundworldmedia.com/linear/linear.html
Linear Regression Calc
The strengths of the Linear Regression Calc: When graphing it was very easy to plot points, I was able to change my axis and there was a great introduction to the site. I could see the points clearly so that I could make a great “eye ball” line. The application completed the line of regressing and provides the yhat equation and the r regression. Also allowed the student to see if this r was significant. Also, this program is able to find values that were not given and able to check answer for yhat. At the end, you are also able to find out if any points should be treated as outliers and how to calculate an outlier.
The weakness of the Linear Regression Calc: Plotting one point at t a time would make for a long time to add long strings of data, I was unable to guess my line before getting the line of best fit or correlation. We are only able to find yhat values between the x values that were stated when looking for another point. (i.e. if (2,10) and 10,25) are given then the value x=15 will not be calculated where x=8 can be). The font is small and a little hard to read.
Overall, this site blew me away. It is too free with shockwave and is great for both Mac and PC. This will be used in a section to teach students about a line of best fit, how to eyeball a line of regression and how to calculate for two variables. I like that we can use this to predict other values quickly. I would use this to predict population and who will win games in the upcoming seasons, and their scores. I think this too will be a great way to have students work at home to do several lines of regression to understand that your eyes are not a great indicator of regression. Also I would use this to show students that a deal on a TV might not be such a big deal by how far it is from the line of regression.

