
By: Melissa Wilson
In this assignment we will investigate some parametric equations. Parametric equations look like this:
x = f(t)
y= g(t)
And we can vary the t and make the ordered pair (x,y) vary with the t. You can do these investigations on many graphing calculators, but for this exercise we will use Graphing Calculator 3.5. The notation in Graphing Calculator 3.5 looks like this:
Then, we can input the values for a, b, and interval for t to vary over. Below we will look at three different parametric equations and how the relationship between a and b affect the outputs. For all of our investigations we will look at t where,
Investigation One -
Here we will look at the following parametric function:
First we will look at when a = b. For this case we will use a = b= 1. The resulting graph is shown below. As you can see that it makes the graph of a circle.
The graph below is for when a<b. We used a =1 and b=4. As you can see, these values stretch the graph in the y direction. Notice that we made the b value to be 4 and now the function crosses the y-axis at 4 and -4. Since the value of sin(t) varies from -1 to 1, when we use a coefficient of 4 the values now range from -4 to 4.
Now, we will look at a>b. We used a=4 and b=1. As you can see below, the original circle is stretched on the x-axis. Also, notice that similar to the previous case, the x-intercepts are now -4 and 4, which correspond to the value of a.
Investigation Two -
Now we will look at the following parametric function:
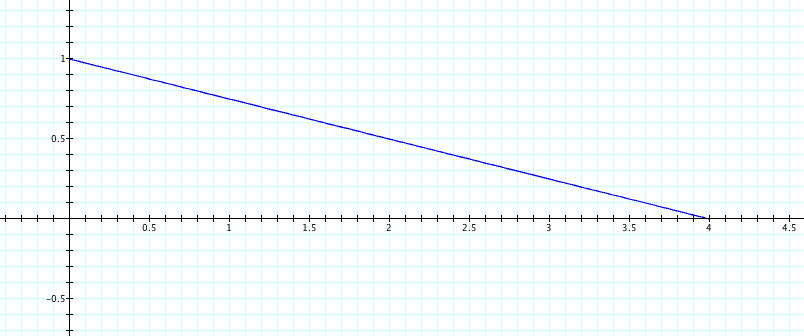
As we did in the previous investigation, we will begin with a=b=1. Below is the resulting graph. Notice that this function only has values in the first quadrant. Since the function is squared then the values are always positive. Therefore, the (x,y) for the function will always have positive values for x and y if we keep the values for a and b positive.
The graph below is for when a<b. We used a =1 and b=4. As we had before, sin(t) takes values from -1 to 1 and adding the coefficient of 4 allows it to vary from 0 to 4 (only positive since it is squared).
Now, we will look at a>b and use a=4 and b=1. Notice that now the x-values range from 0 to 4 coming from a similar argument as the previous case.

Investigation Three -
Lastly, we will look at the following parametric function:
First we will look at when a = b. For this case we will use a = b= 1. Now that we are using an odd (as opposed to even) exponent, we will once again have the possibility of negative values for x and y.
The graph below is for when a<b. We used a =1 and b=4. As before, the 4 coefficient for b gives the function a range of y values from -4 to 4.
Now, we will look at a>b and use a=4 and b=1. The value of 4 for the a coefficient allows the function have x-values that vary from -4 to 4.