
Ronald Aguilar
I pulled the assignment from Assignment 1, problem number . Here, we will graph the function
![]()
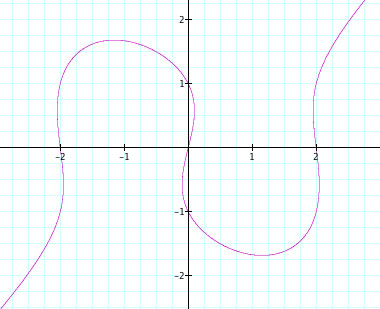
First, notice the shape of this graph. Second, take into account the number 4 in the left side of the equation and the number 1 in the right side of the equation.
Now, lets alter the value, where 4 is, on the left side of the equation and see what happens.
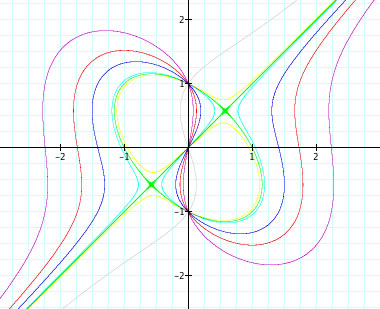
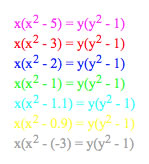
Here are the functions for each graph:
If we look at the initial graph of ![]() , we can see that the function intersects the graph at x = -2, 2. Also, the graph interects the graph at y = -1,1.
, we can see that the function intersects the graph at x = -2, 2. Also, the graph interects the graph at y = -1,1.
There are different variations of the functions, changing based solely on the variable x. Notice how all graphs y values stay the same, but change based on x. The function ![]() focuses on the changes in value x. Those values are affected by n = 5, 3, 2, 1 ,1.1, 0.9, and -3.
focuses on the changes in value x. Those values are affected by n = 5, 3, 2, 1 ,1.1, 0.9, and -3.
All the graphs intersect at y = -1,1. We understand this to be because of the right side of the equation, ![]() .
.
Once the functions values, inside the parentheses, get closer to each other, the graphs want to intersect each other. Finally, when they do intersect at ![]() , they create two points of intersection.
, they create two points of intersection.
Also, the graph with n = -3, in the equation ![]() , seems to mimic the graph with n = 3. However, the symmetry with the origin is not present because of the additive property.
, seems to mimic the graph with n = 3. However, the symmetry with the origin is not present because of the additive property.
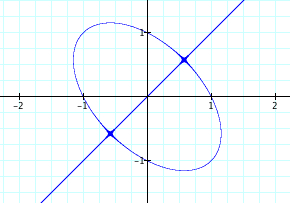
Lets see what happens when we graph ![]() and
and ![]() independently of one another.
independently of one another.
=y().jpg)
![]() in blue
in blue
![]() in red
in red