Polar Equations
Allyson Faircloth
For this investigation, we will be looking at
. We will see how varying a and b changes the graph.
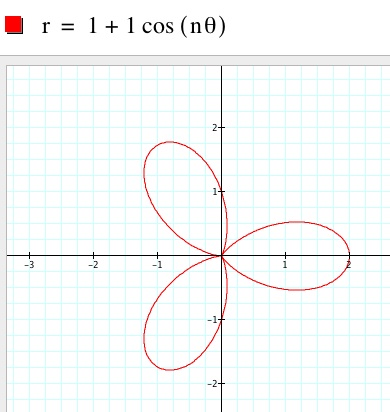
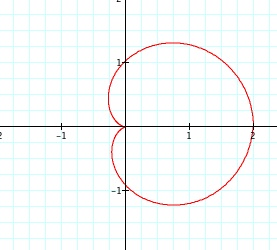
First let's look at
.
We can see that we get the "n-leaf rose" shape. We also have y-intercepts of 1 and -1.
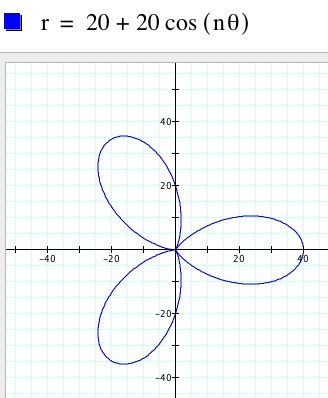
Let's look at different values for a and b.
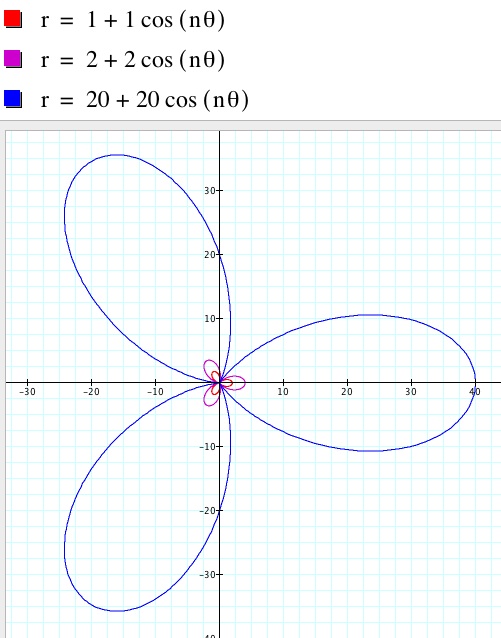
We can see that when a and b are both 2 we now have larger petals and y-intercepts of 2 and -2. Then when a and b are both 20 we have even larger petals with y-intercepts of 20 and -20. We can conclude that the larger the values are for a and b, the larger the petals of our "n-leaf rose" will be. Also, we will have y-intercepts at n and -n. Below is an image of all three pictures together.
Now let's take a look at a
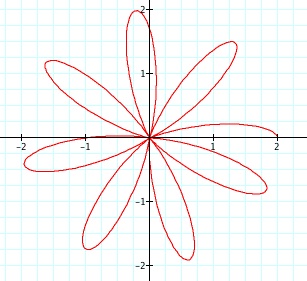
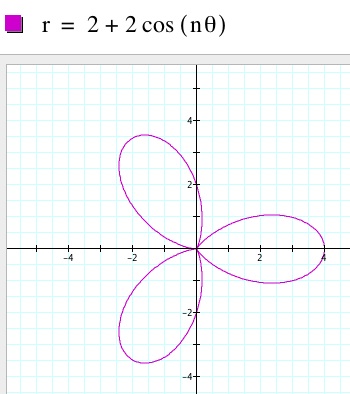
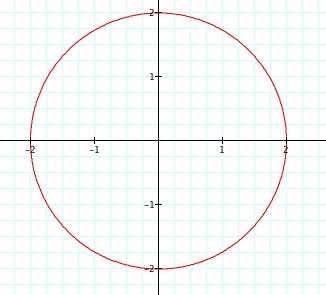
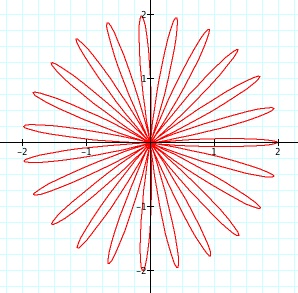
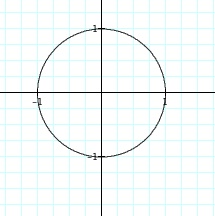
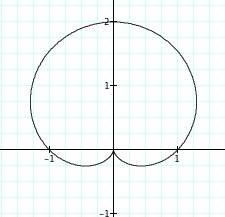
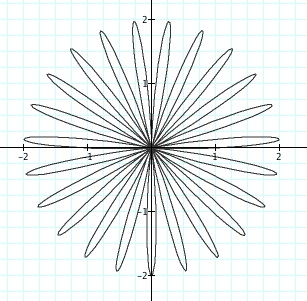
If we look at the animation above at specific times, we can notice some interesting things. First of all, when n = 0, we just get a circle. Then when n = 1, we get an odd shaped petal. Then an n gets larger, we notice that each time n changes we have n number of petals for our "n-leaf rose." We can even see that when n is not a whole number, we get partial petals.
n = 0 n = 1 n = 23 n = 7.5
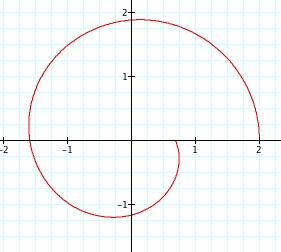
Another interesting aspect of varying n is for the time when 0 < n < 1. For this interval we have a spiral because n has not yet reached 1, and therefore a whole petal has not been formed yet.
n = 0.3
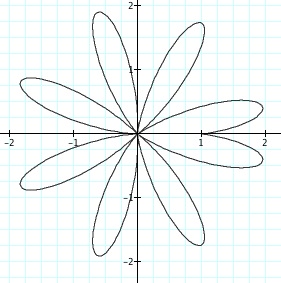
Lastly, let's look at what changes when we use sine instead of cosine.
We see that we have very similar results. The variable n still relates to the number of petals we will have, yet those petals are not in the same spots. They have been rotated ninety degrees counter-clockwise.
n = 0 n = 1 n = 23 n = 7.5
Return