Examining the graph y = a sin (bx + c) allows for some very interesting findings. Realizing that by changing a, b, and c we will be changing the parameters of the sine graph.
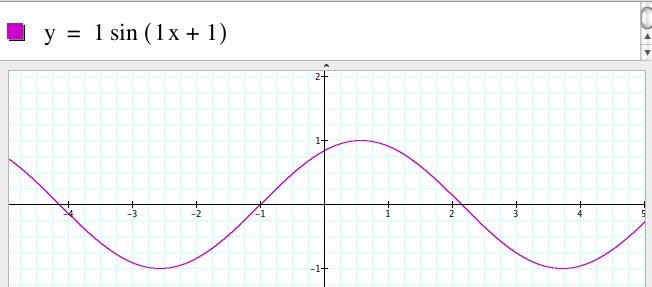
First let’s look at how a affects the graph of y = a sin (bx +c). We can start by setting a equal to 1. However, if we set b and c equal to zero we would simply get the graph of the x-axis since sin(0)=0. For that reason we will begin with all parameters equal to 1.
We can see that this is the sine curve shifted to the left one unit. But what happens if we increase a to a much larger number?
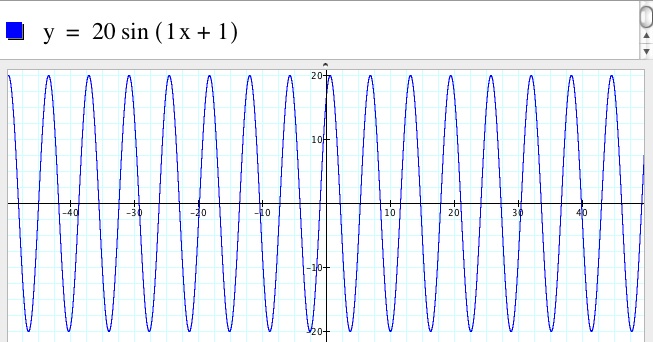
Now we see that the maximum and minimum values of the graph are now 20 and -20. This leads to the idea that a is the parameter for the amplitude of the sine graph. Let’s see if this holds true for negative values of a.
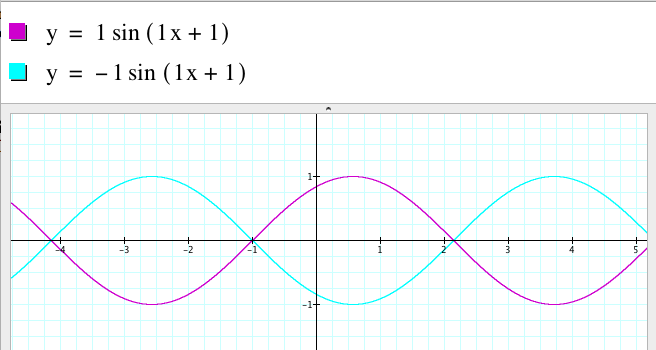
The graph of y = -1 sin(1x+1) where a is now a negative value shows that a negative value for a or the amplitude of the sine graph changes all positive values to negative values and all negative values to positive values, making the graph appear to have reflected across the x-axis. Let’s try another negative value for a to see if our idea hold true.
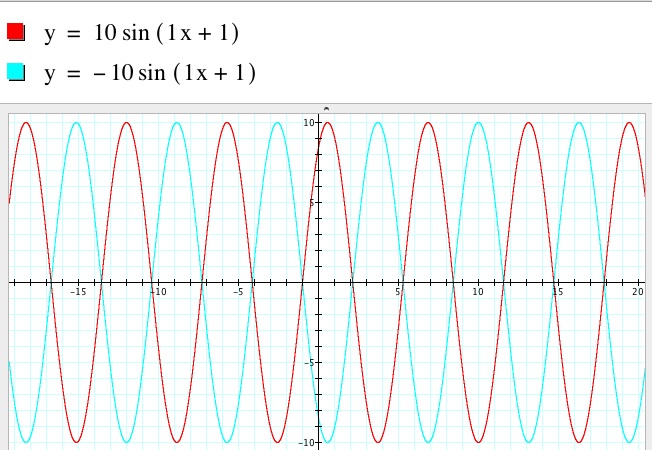
We have found the same results. So the parameter of a deals with the amplitude of the sine graph. The absolute value of a will be the maximums of the graph and the negative absolute value of a will be the minimums of the graph. Also, a negative value of a will reflect the graph across the x-axis.
Next, we will look at how different values for b will affect our graph.If we first look at an animation below of b changing from -5 to 5, we can see that the parameter b seems to deal with how long it takes the graph to start repeating itself or the period of the sine curve. The animation of the graph looks like a spring which is being squeezed together as b gets closer to 30 and a spring which is being stretched as b gets closer to 0. The mathematical reason is because the periodicity of the sine function is 2π, and the periodicity of the sine curve is
. Therefore, as b gets larger the period of the sine curve is getting smaller. That results in more curves and the spring to look like it is being squeezed. Similarly, as b gets smaller the period of the sine curve gets larger. That results in less curves and the spring to look like it is being stretched out.
y = 1 sin(nx +1)
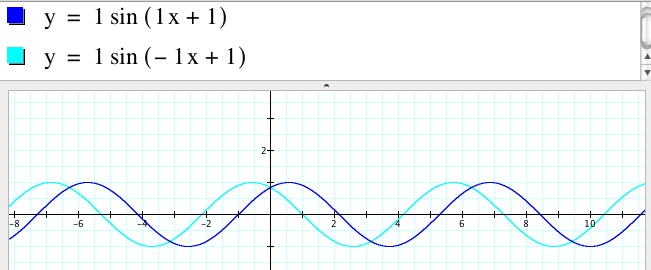
Now we can look at negative values for b.
By comparing the graphs of y = 1 sin(1x + 1) and y = 1 sin(-1x + 1), we can see that the graphs are the same except for the negative graph appears to be shifted to the left and both graphs repeat themselves every 2π units or approximately 6.28 units. This is also from the fact that the periodicity of the sine function is 2π, and the periodicity of the sine curve is
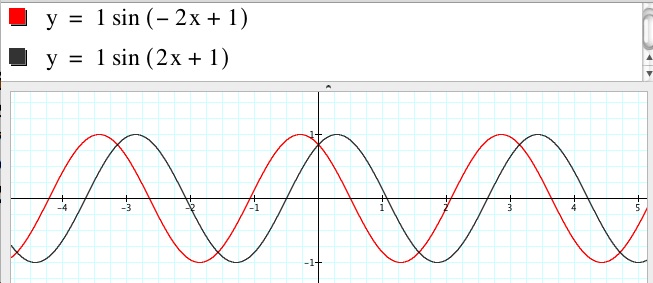
If we compare the graphs of y = 1sin(2x + 1) and y = 1sin(-2x + 1), we then can verify that a negative value for b reflects the graph across the y-axis.
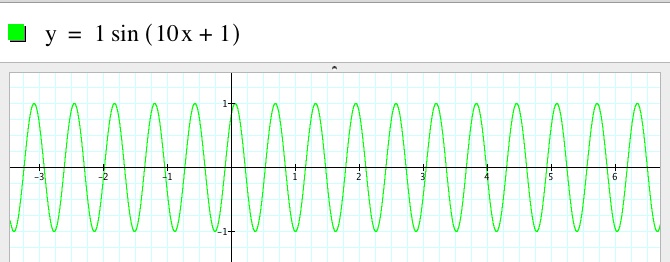
Also, if we take another look at y = 1sin(-2x + 1) we can see that when b = -2 the graph repeats twice every 2π units or once every π units. Before when we looked at y = 1sin(1x + 1) the graph repeated itself once every 2π units. So b is the number of times the graph will repeat within 2π units? Let’s check try one more value of b to see if our idea holds. Let’s look at y = 1sin(10x + 1).
For b = 10, once again the graph repeats itself 10 times with in 2π units, or it repeats once every .628 units.
Therefore, the repetition of the graph is determined by the parameter b. The graph will repeat itself b times in 2π units or it will repeat once in 2π/b.
Lastly, we can look at how the parameter c affects the graph of y = asin(bx + c).
An animation of the graph with c changing between 0 and 100 looks like a wave that never changes shape yet moves to the right when c gets smaller and moves to the right as c gets larger. It seems as though the value of c shifts the graph horizontally along the x-axis.
y = 1 sin(1x +n)
Let’s look at a few different graphs to see if we can make a conclusion.
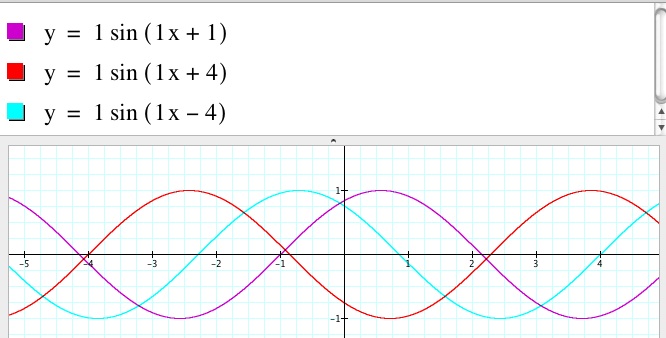
By looking at y = 1 sin(1x+1), y = 1 sin(1x+4), and y = 1 sin(1x-4), we see that c does indeed shift the graph.
However, when c is equal to -4 the graph shifts to the right 4 units and when c is equal to 4 the graph shifts to the left 4 units.
We can now see that a positive value for c will cause a shift of c units to the left, whereas a negative value for c will cause a shift of c units to the right.
In conclusion, the parameters a, b, and c all affect the graph of y=asin(bx + c) if different ways. The parameter a will change the height or amplitude of the graph. B will change how often the wave pattern of the graph repeats itself. Lastly, c shifts the graph horizontally along the x-axis.
For a further exploration, we might look at how a fourth parameter may affect the graph, such as y = a sin(bx + c) +d. In this case, d would b a vertical translation of the sine curve.
Return