
*Some of the graphs on this page can only be viewed properly from a full screened browser.
y = ln(x) is shown in purple
y = log(x) is shown in red
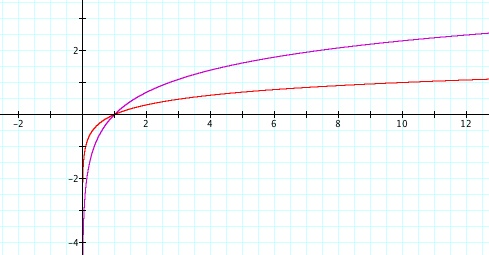
As shown in the graphs, both functions are unable to be evaluated for negative numbers. Both functions are also always increasing, and have an asymptote at the line x = 0. As the x values get larger and larger, the y values continue to increase, but it happens more and more slowly. The point (1,0) is on both graphs. One particularly interesting point on both graphs is the point at which it is increasing at a constant rate, or in other words, the point on the graph where the derivative is 1. In the y = ln(x) graph, this point lies at (1,0), and in the y = log(x) graph, this appears to happen when the x value is just below 0.25 and the y value is just above -0.25.
It is not difficult to see from the graph that ln(e) = 1 and log(10) = 1.
We will now look at what happens when we multiply both expressions by a constant.
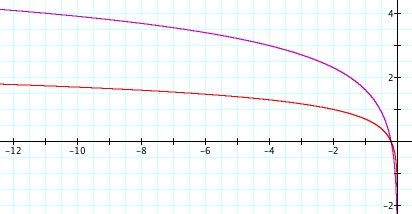
y = 5ln(x) is shown in purple. (First Graph) y = -5ln(x) is shown in purple. (Second Graph)
y = 5log(x) is shown in red. (First Graph) y = -5log(x) is shown in red. (Second Graph)
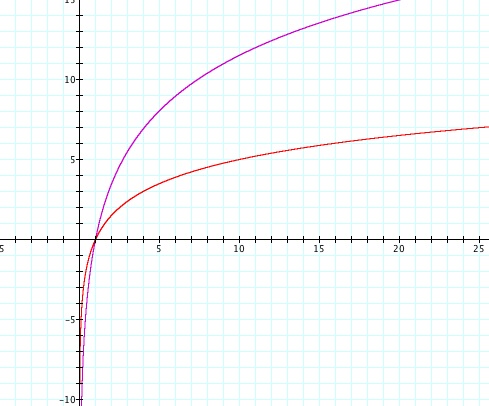

As one might expect, the graphs are simple stretched away from the x-axis by a factor of 5 when multiplied by 5. The graphs on the right are simply the reflection across the x axis of the graphs on the left. The property that the graphs are always increasing remains the same when the constant is positive, as shown on the left. When the constant is negative, as shown on the right, the graphs are always decreasing. Once again, both graphs have an asymptote at the line x = 0. Also, when multiplied by a constant, the point at which the graph increases (or decreases if the constant is negative) at a constant rate, meaning the derivative is 1 (or -1), moves. In the case of y = 5ln(x), this point looks to be around (5,8), and in the case of y = 5log(x), this point looks to be around (2,1.5).
We can see from the graphs that:
5ln(e) = 5,
5log(10) = 5,
-5ln(e) = -5, and
=5log(10)= -5.
We will now look at what happens when we multiply both variables by a constant.
y = ln(5x) is shown in purple. (First Graph) y = ln(-5x) is shown in purple. (Second Graph)
y = log(5x) is shown in red. (First Graph) y = log(-5x) is shown in red. (Second Graph)
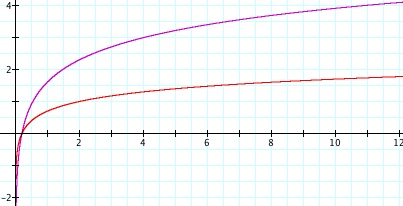
As one might expect, the graphs are reflections of each other across the y-axis. The change in these graphs from the original is more difficult to describe than the previous change. Instead of intersecting at (1,0), the graphs intersect much closer to the origin. They are still have the line x = 0 as an asymptote. The graphs on the left are always increasing, and the graphs on the right are always decreasing. The point at which the graph increases (or decreases if the constant is negative) at a constant rate, meaning the derivative is 1 (or -1), moves again. In the case of y = ln(5x), this point looks to be around (1,1.6), and in the case of y = log(5x), this point looks to be around (0.6,0.5).