
Problem:
Graph
for some appropriate range for t.
Interpret. Is there anything to vary to help understand the graph?
Write up:
I begin by simply graphing the original parametric equation where x = t+ 1 and y = 2t-1. You may see this result below:
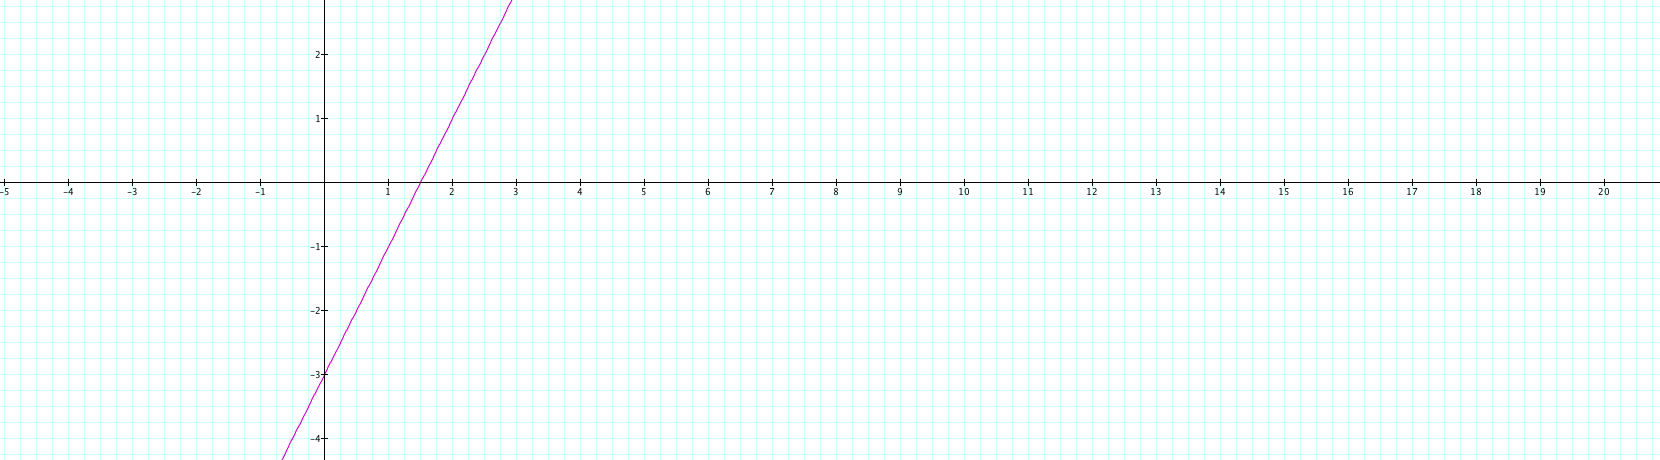
So what exactly does this mean? For this graph and those upcoming, I used a range of t from -15 to 15. So what would we expect to see? Well, for every t that is input, the output graph will plot points that are one more than t for x and 2 times t minus one for x. Thus, one would expect that the lowest y value you would see is -31 and the highest you would see in this case, with the given range, would be 29. For x the values would range from -14 to 16. Thus the minimum point would be (-14, -31) and the "highest" point (in a graphical sense) would be (16,29). I verified that this was the case in the graph, and the graph only shows from those two points.
But how would one vary the input equations to see differences on the screen? Well, one idea is to make x = t-1 instead of x = t+1, i.e. change the sign of the constant. What effect does this have? Let's see...
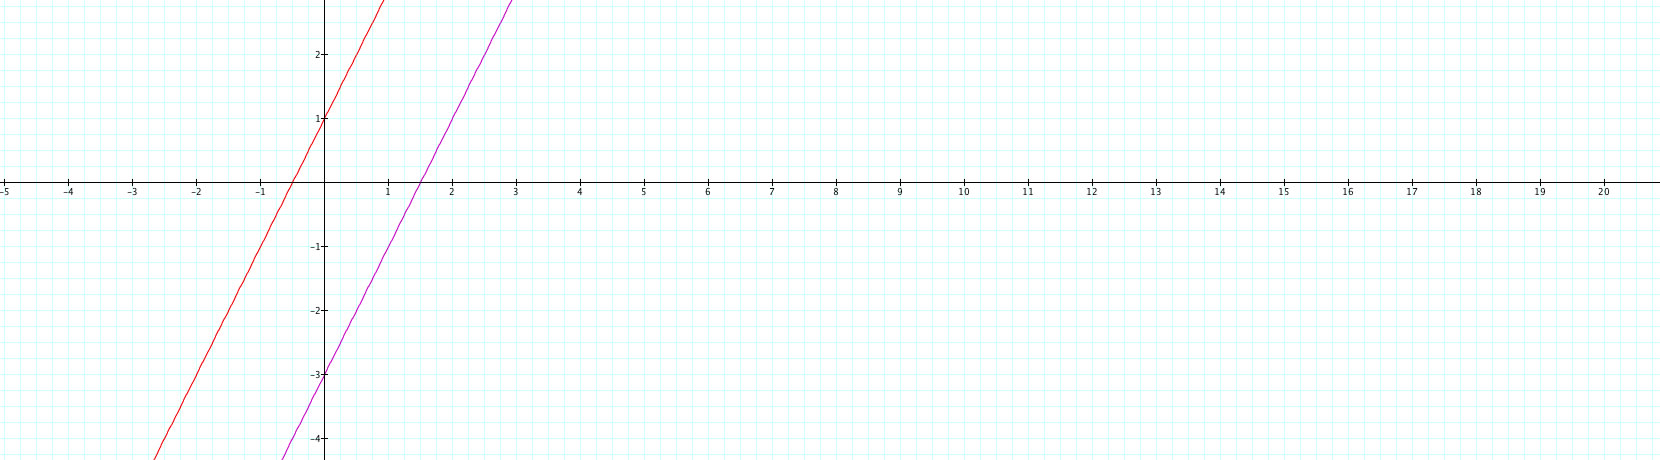
The pink graph is the original, and the red is the changed graph. So what happened? It seems like the change in a negative direction numerically shifted the line in a negative directon as well. Now x equals to zero when y equals one, instead of the original function when x equaled to zero when y equaled negative 3. This makes sense because now t has to be 1 to make x zero, which means that with y = 2t-1, y = 2(1)-1 = 1 as expected. Is there anything else we can do to this graph other than shift it to the right or left?
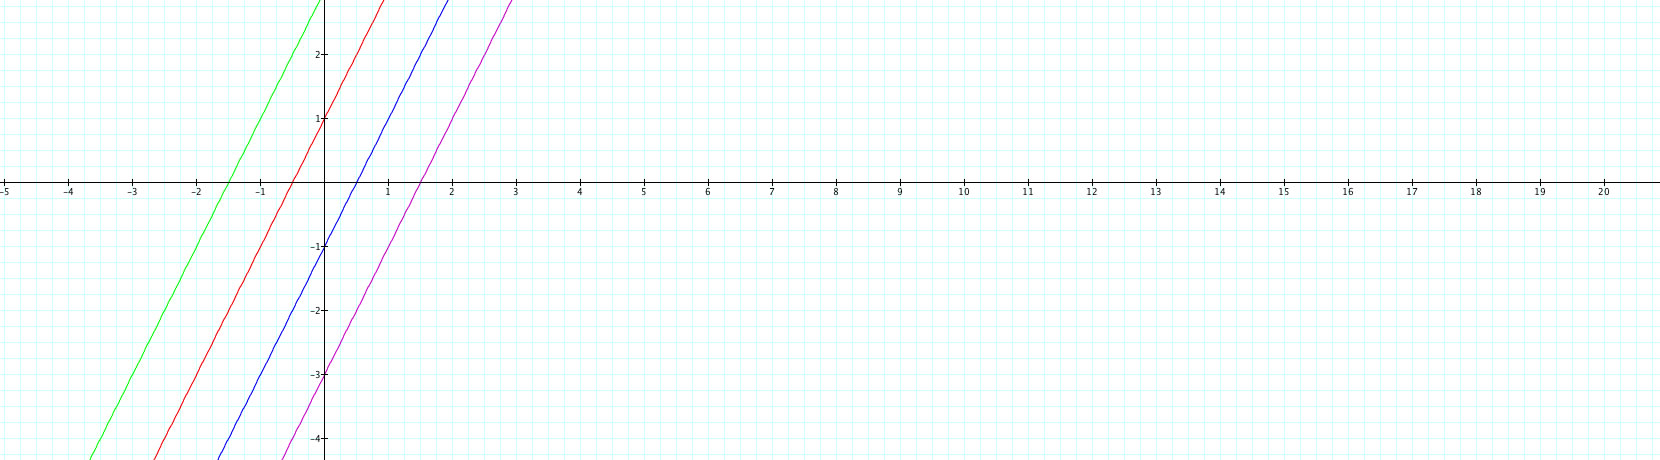
Below I show a couple more attempts at changing the graph. The blue line shows when x = t+1 and y = 2t+1, changing the y function and leaving the x function alone. The green function shows when both are changed, x = t-1 and y = 2t+1
Now this doesn't look very interesting so far. What else could be changed? Let's attempt to change the coefficient in front of the t! OK. So now what if x = 2t+1 and y remains the same at 2t-1? See the graph below:
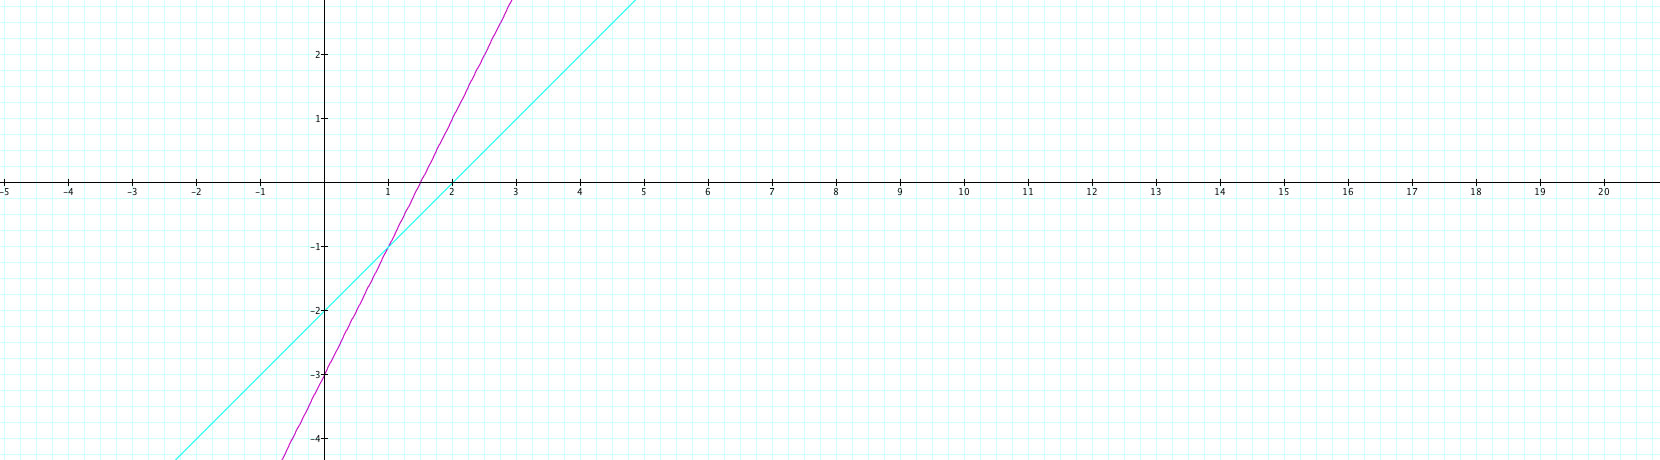
Oh! So now we have not seen a shift. Rather, we have brought about a change in steepness to the graph. The slope has changed. This seems to make sense because we have changed the multiplier in front of t thus giving it less or more effect on the slope. In this case, we have a less steep slope, due to an increase of the x value (rise over run, the run is getting larger so the slope has gotten smaller). The opposite will happen when you change the coefficient in front of t in the y function, as shown below:
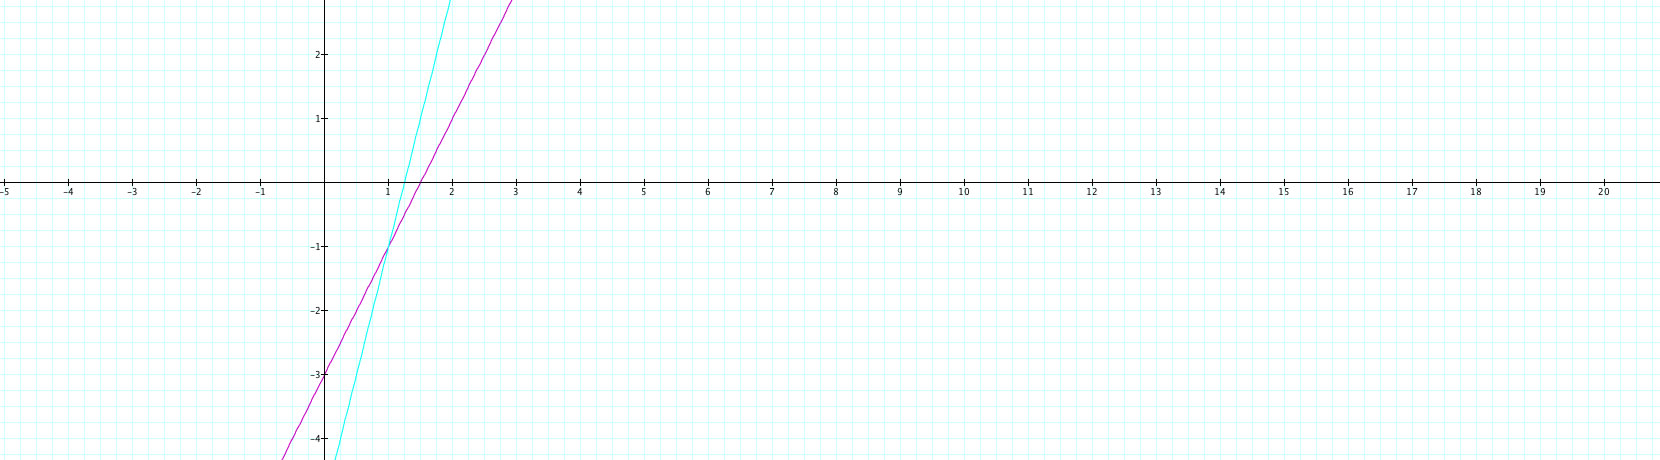
Here, the graph in the turqoise has the same x function as the original parametric equation, but a new y function, with y=4t-1. Now, the multiplier in front of the t is larger in the y value, and as expected the slope has changed to become more steep. All of this is very similar to what is done in "normal" x-y graphing, but with a parameter involved. Shown in this way, parametric functions can be less scary to school children.
One last change. What if we changed the t values to be squared? The result of making x = t2 +1 and leaving the y the same is below:
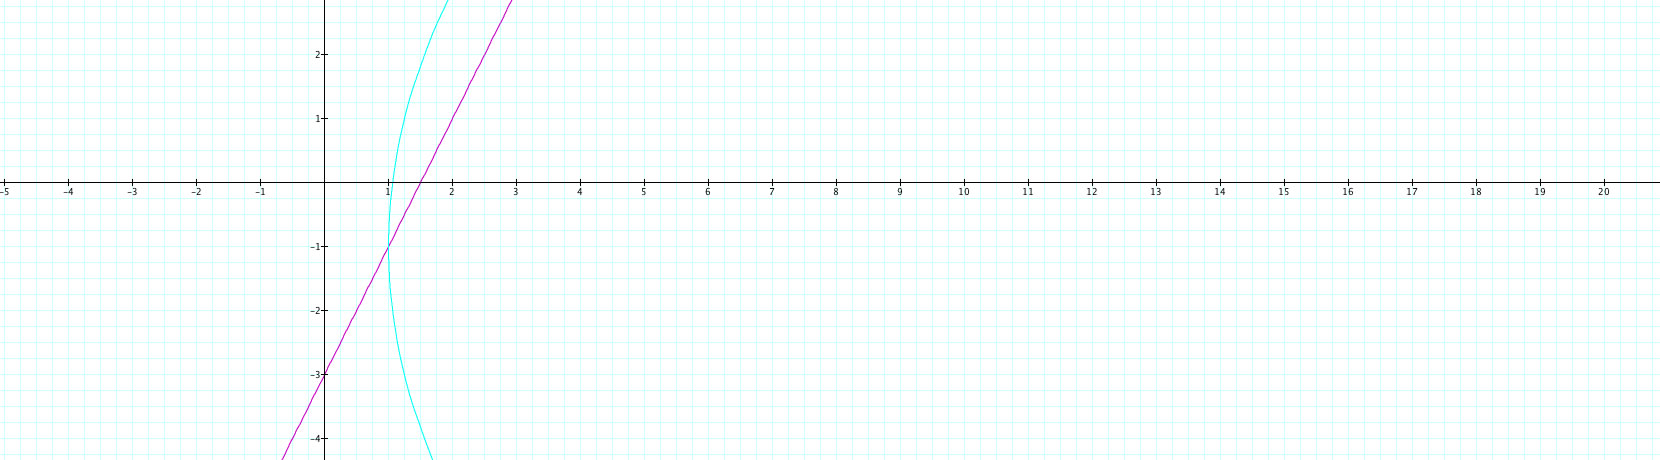
As one would expect, there is a much more quadratic nature to this graph. As one would expect, x never becomes any less than one because any number input for t will be squared. The same is true if you squared the y value but not the x value. You would get a similar graph with a bound on y instead of x.
What happens if both are squared? The result is below:
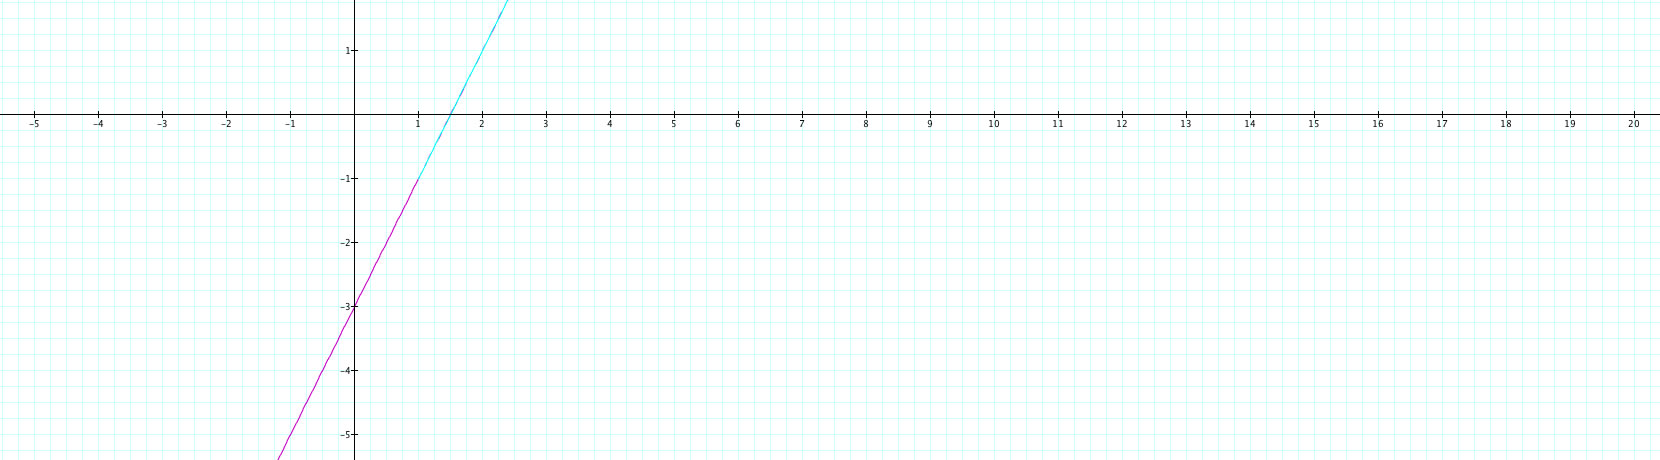
Although it is not completely visible here, we get an interesting phenomenon where the turquoise graph is on top of the pink graph (the original) but only for values of y greater than -1 and x greater than one. Also, the turquiose line extends out further in the positive direction. Finally, the graph is linear instead of quadratic as one might expect. It seems as though the "bounds" due to squaring remain, but the shape doesn't change due a canceling out effect of squaring the t in both the x and y functions.
Overall, there are 3 main things I found that you can do to change the original graph.
1. Change the constant to shift the graph left or right.
2. Change the coefficient in front of the t in order to change the slope of the resulting graph.
3. Change the power of t in order to change what type of function is output.
Those darn parametric equations!