
Problem: Consider again the equation
Write up:
First, I will look at one example. What happens when we let c = 1 as is shown above, to get x2+ bx + 1? The graph is very interesting.
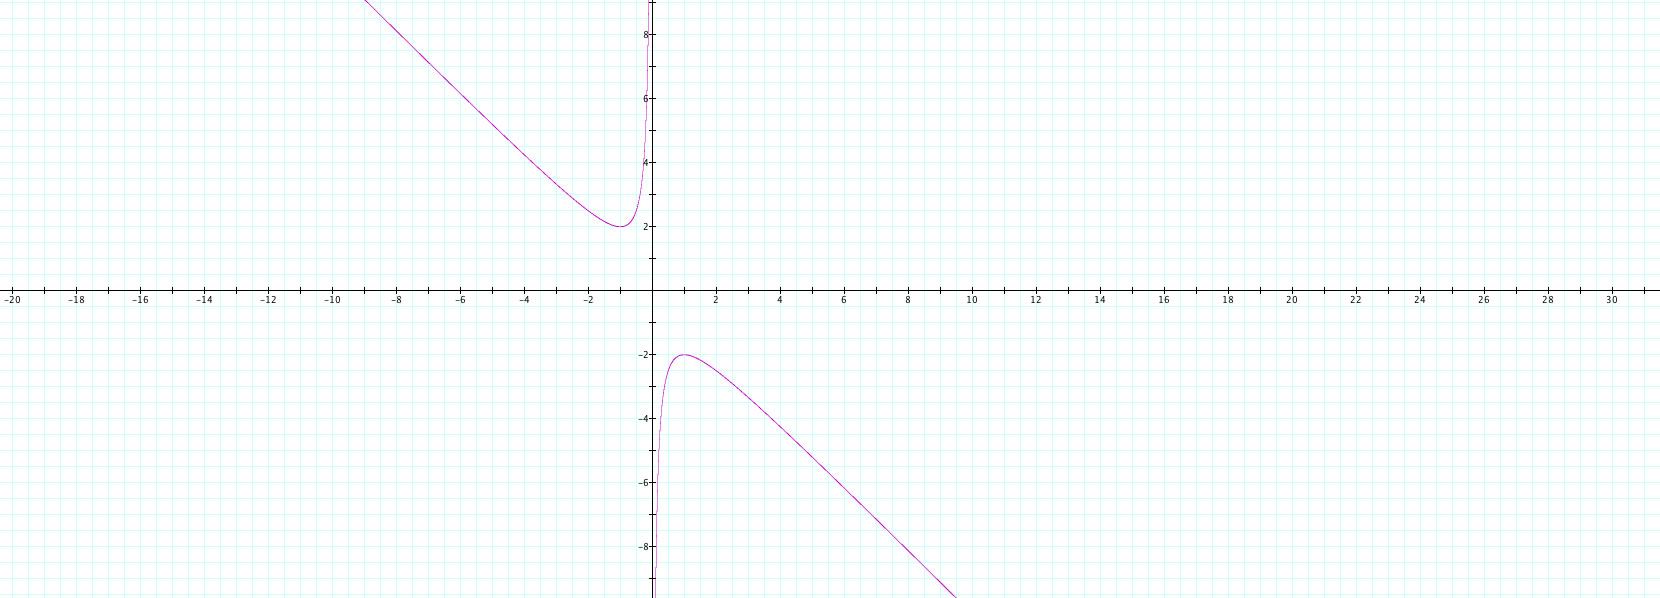
Just from looking at this one graph, it would seem like there is an asymptote at x = 0, meaning that the graph approaches it but y goes to positive and negative infinity for negative and positive values for x respectively. Also, it seems like there are no y values between -2 and 2. Is this true? We need to investigate more graphs to see this.
What if I let c = 3 and get x2+ bx + 3? How would this change the graph? Leaving the first graph on, we see the following:
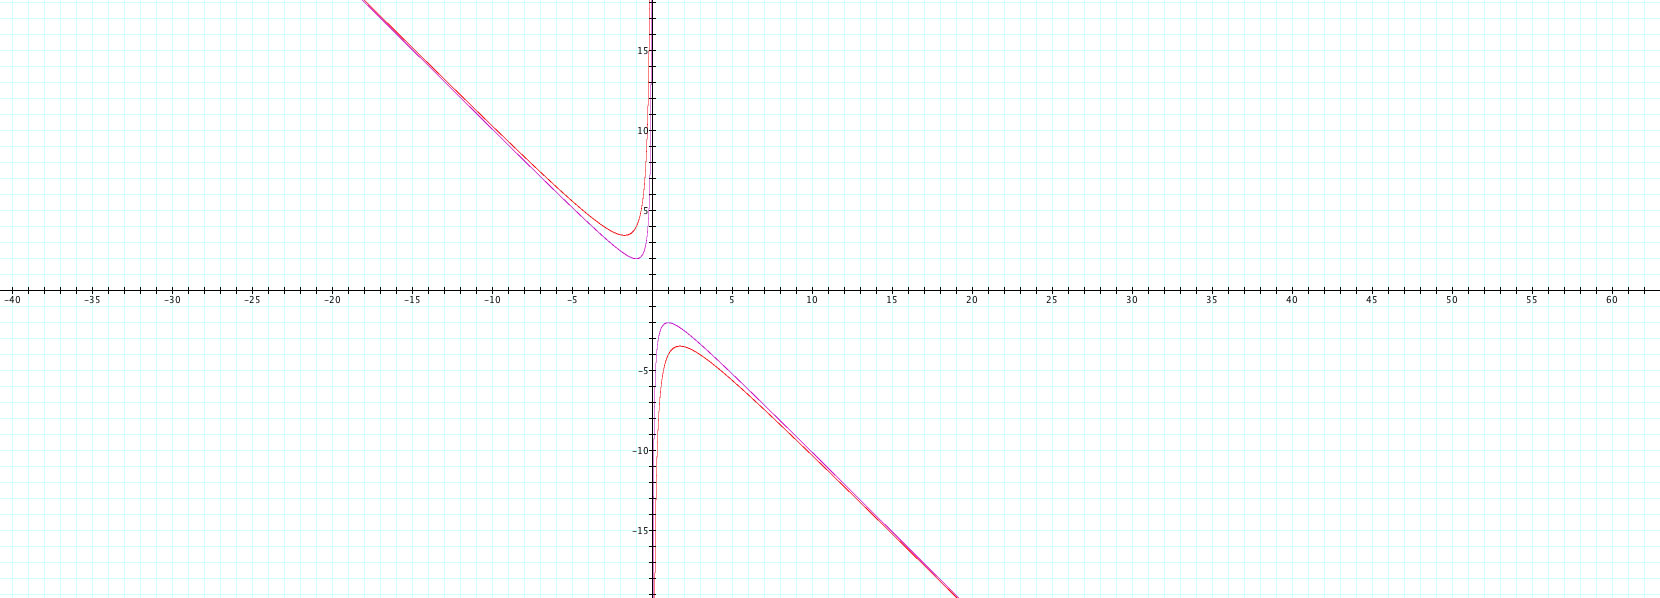
When adding in the graph with c = 3, we see a similar looking graph. However now it seems like there are no outputs between -3 and 3 (or a little below and above -3 and 3). So there definitely seems to be some sort of pattern here. Let's see if this occurs for other values of c.
The below graph shows the functions with c=1,3,5,7, and 9 all in the same window. Will we see the same pattern?
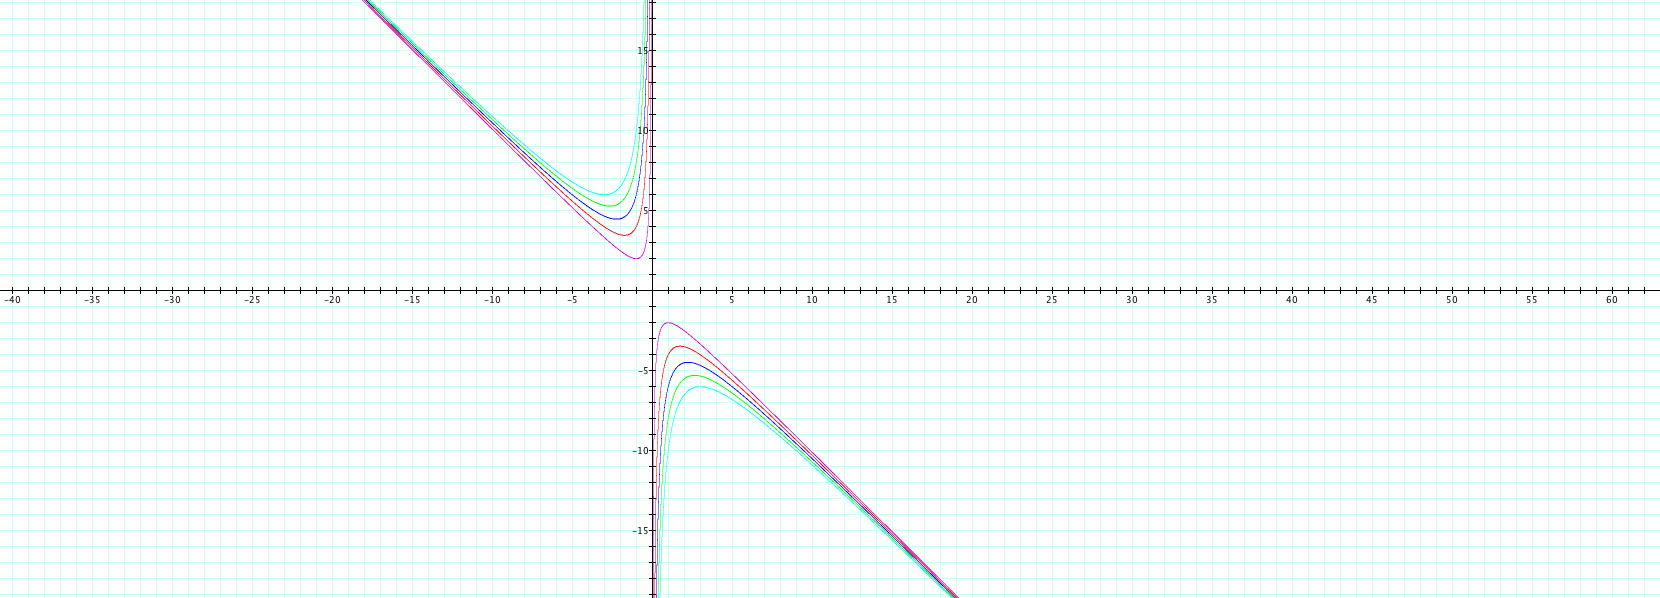
Indeed it seems like the same pattern has held. As the value of c increases, we see that the number of b values being excluded (or out of the range) is increasing as the graph gets further and further away from the x-axis.
What happens when we overlay a line, say b equals some value, what would that mean, and what would that look like? An animation of such line is shown below:
As you can see, the line b = (some value) is moving up and down the graph. What does the line represent? Well when b passes through , for instance, b =3, the first graph (with c = 1) has two real (negative) roots. However, in all the other graphs (c = 3,5,7, and 9) , the functions do not have any real roots when b = 3. This can be verified in the quadratic formula as well, where you will get imaginary values.
One can imagine the situations that occur as b varies. For instance, when b = -3, then the same situation holds for c = 3,5,7,9, but in the case of c = 1, the real roots are now positive. Again, one could verify this fact by checking the quadratic formula. What about when b is less than 2 but greater than negative 2? In those cases, none of the functions have real roots!
Finally, what occurs at the lines b =2 and b = -2? Well it appears that the original graph with c = 1 will have one real root at both b = 2 and b = -2. When b=2, the root will be negative and with b=-2 it will be positive. Overall, we can assume from the animation that the line will cross the graphs 0, 1, or 2 times and thus depending on the b the equation will have 0, 1, or 2 real roots.
What happens when c is negative? Let's add the case of c = -1 to the graph we have already seen. What do we expect in this case? Without looking, I guessed that the "vertex" of both "parts" of the hyperbolas would flip axes. However, I was found to be wrong as seen here:

Looking at the graph in Black, we can see that it has what seems to be another type of behavior. The graph does seem to get closer and closer to the other hyperbolas but never quite reaches equality. Also, the graph approaches x=0 but again does not seem to reach it. If there was a guess to be made, it would seem like the graphs were flipped over the b = -x axis. However, we can't be really sure just from looking at this graph. Let's add the cases where c = -3,-5.-7, -9 to the mix and see what happens:
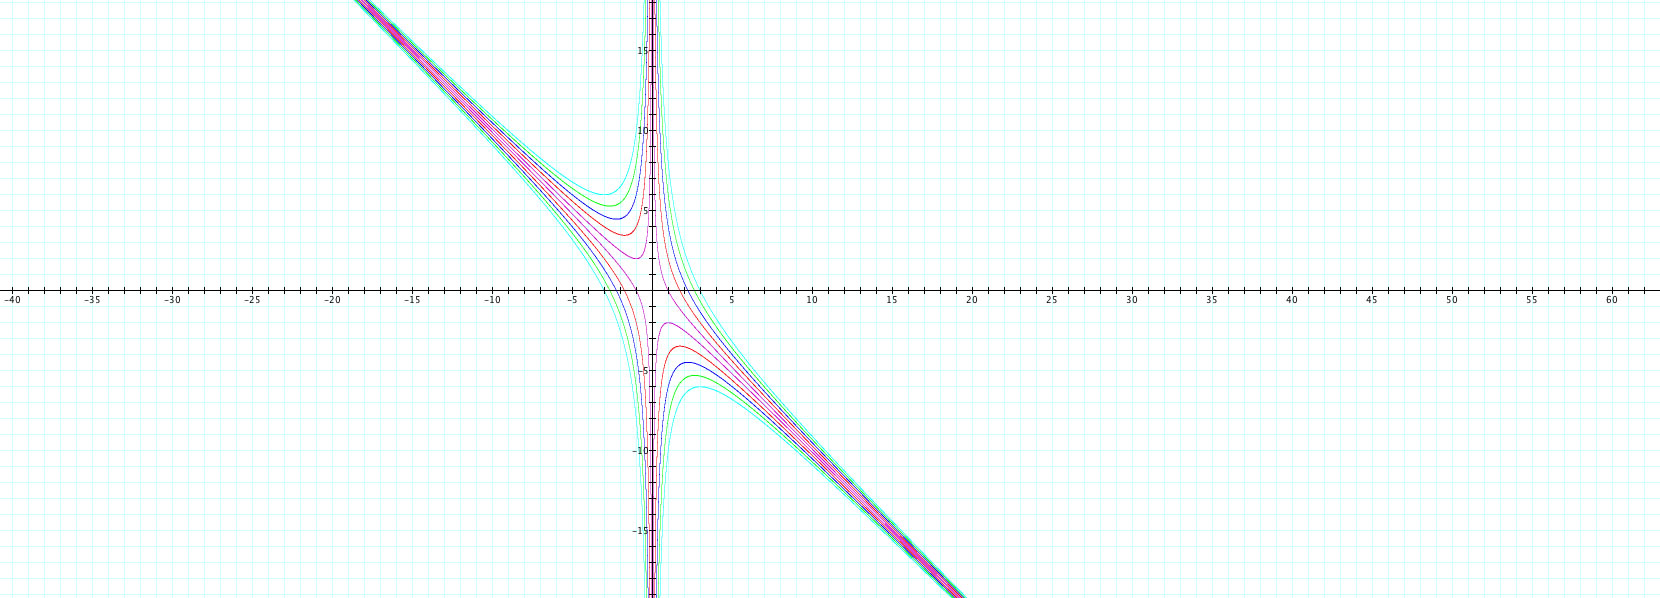
Whoa! What a colorful mess that is. It seems to have created a family of hyperbolas, with the properties I discussed above. I have not be "unconvinced" that the line b=-x is not a reflection point (i.e. the graph with c = 1 is reflected over b = -x to create the c=-1 graph). Also, it holds true that x = 0 is untouched by these hyperbolas and thus x = 0 is NEVER a root to any of these types of equations.
To tickle my fancy, I have added the line b = -x to the graph to see what that shows us:
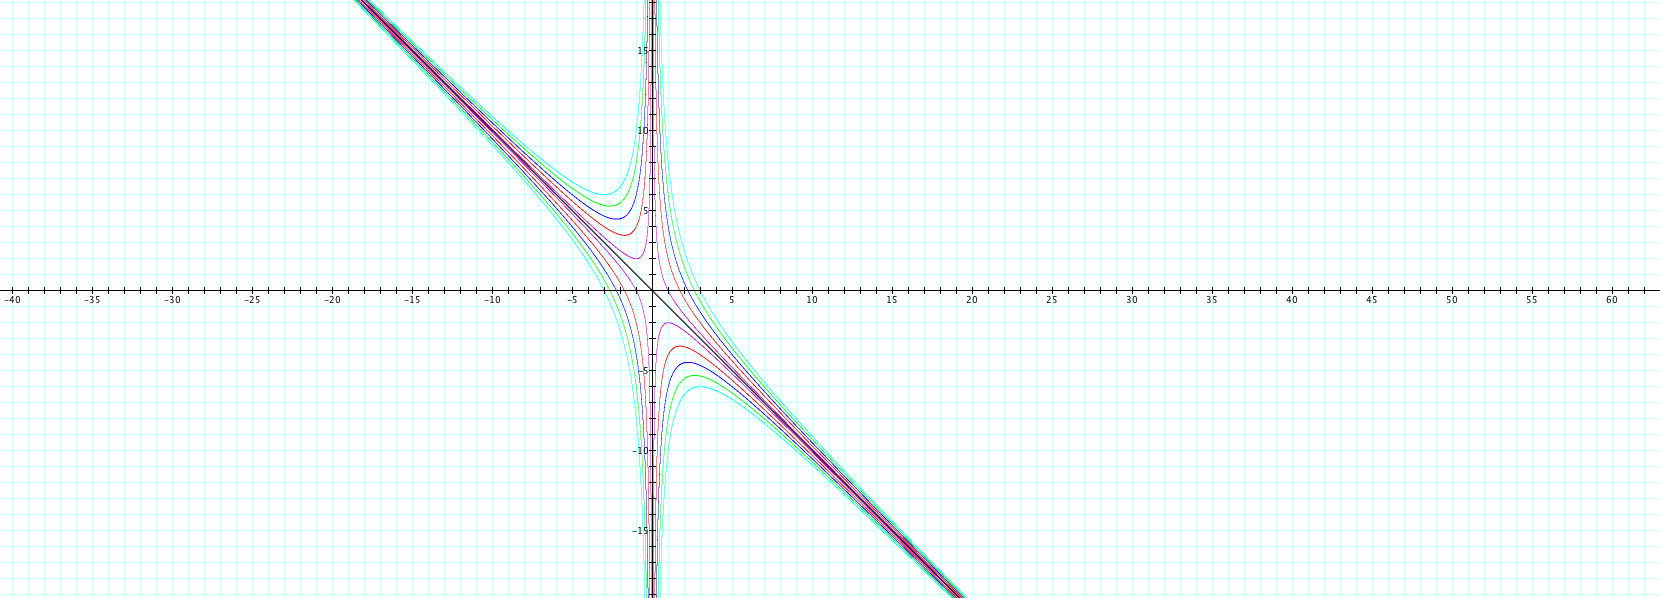
Voila! It does appear that this line, b = -x passes between all of the hyperbolas. I am second guessing my thoughts of a "reflection" however because the shapes of the graphs are not the same. When c is negative, the graphs are much wider than those when c is positive. However, it does seem to be the reflection line for the different parts of each hyperbola. Nevertheless, this b = -x line added shows us that the line is certainly an asymptote for the entire family of hyperbolas of this given form.
One question remains: When c is negative, what does the line b = n (with n some constant) show us. In the case of c being positive, we saw a variety of how many real roots the function had when b varied. However, as b varies in this case, it appears that the functions will always have two real roots, one positive and one negative. This seems very feasible when thinking about the quadratic formula and how a negative c would multiply the negative 4 in the "4ac part" to form a postive value. Thus the value under the square root will always be positive leading to 2 real roots in the cases of these quadratics.
Boy the things you can learn about quadratics!