
Quadratic Equations
Elizabeth Nelli
Here we see a graph of differing variations of the equation ![]() , where a=1 and y=b. The c values range from -5 to 5, in 1 unit increasing order.
, where a=1 and y=b. The c values range from -5 to 5, in 1 unit increasing order.
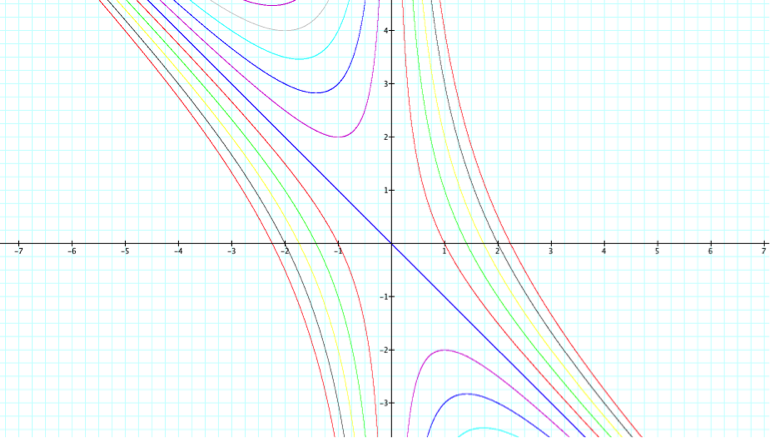
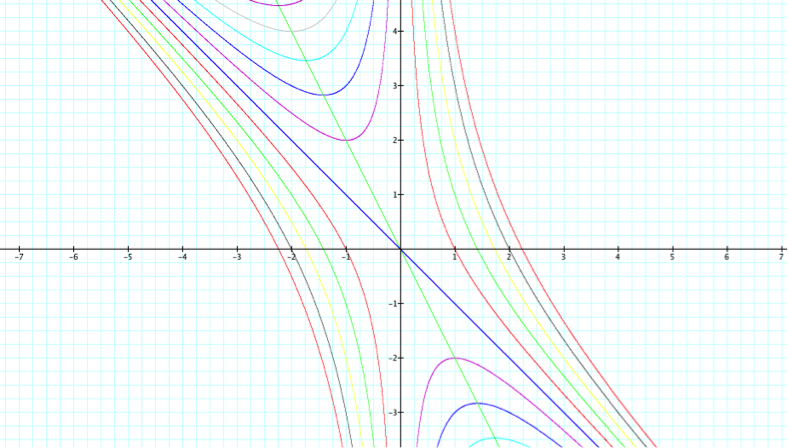
The green line passing directly through the origin represents this equation. This line passes through the points midway between the sides of each of the hyperbolas, meaning it is the minimum and maximum points on each hyperbola part, where that exists. To obtain this line, we must take the derivative of the above equation (where y=b).
Because these lines are hyperbolas, the line x+y=0 and the line x=0 are asymptotes and any horizontal appearing on the graph will intersect the hyperbolas where roots occur.
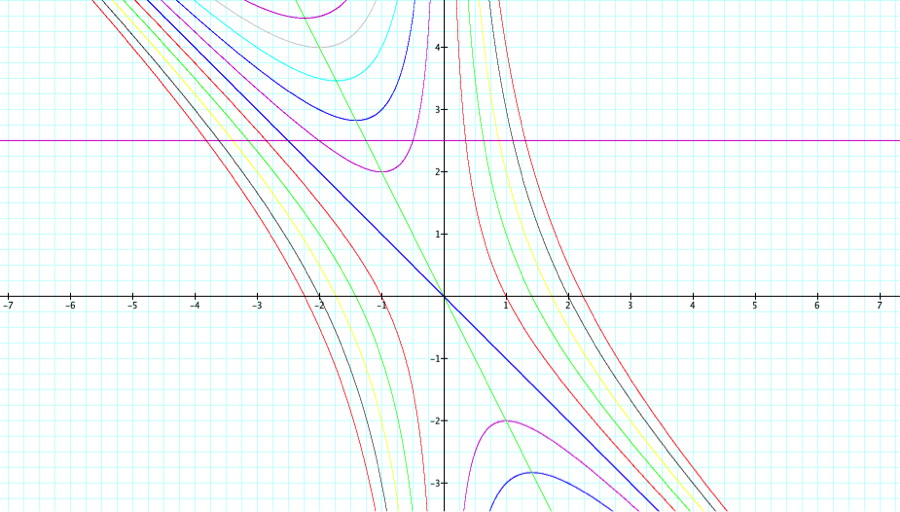
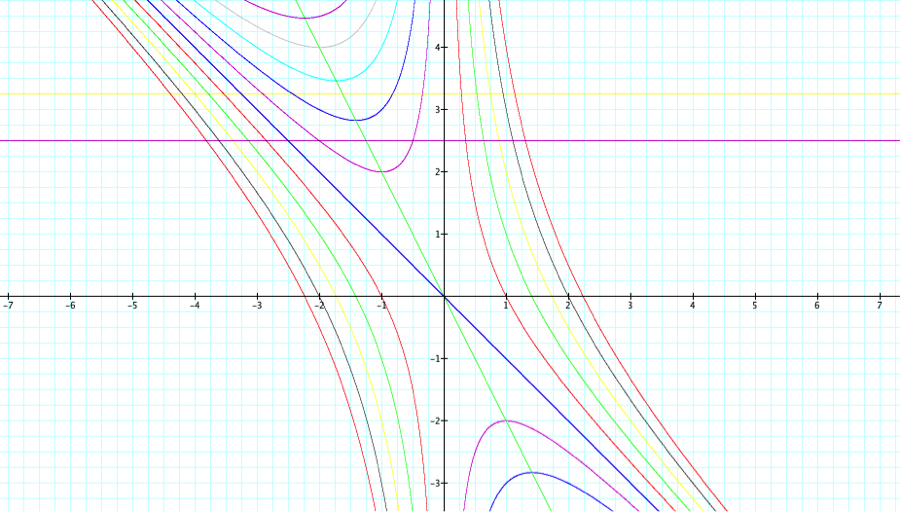
All of these are depictions of roots of the hyperbolas.
We know the quadratic equation is ![]() and the quadratic formula is
and the quadratic formula is ![]() or
or ![]() .
But not all of us know what each part represents graphically.
.
But not all of us know what each part represents graphically.
The ![]() represents the point of intersection with a horizontal root line (aka: the midpoint) and the
represents the point of intersection with a horizontal root line (aka: the midpoint) and the or
or  represents the distance on either side of the midpoint.