Kassie Smith
The inspiration and slight adaptation of the following material came from attending at session presented by Kenn Pendleton at the Georgia Council of Teacher's of Mathematics (GCTM) conference on 10/18/2012. Thank you!
The goal for this lesson (or really series of lessons) is to allow students the opportunity of discovering the relationship between fractional exponents and logarithms.
Before students would begin this, they should have already been introduced to exponents and have a grasp on their properties. Ideally, this too would have been done with individual discovery of the laws of exponents. Discovery is preferred to memorization because we want students to be responsible for their learning and to be making sense of the mathematics and the relationships. How do you do this?
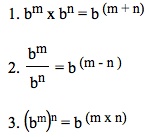
First, what am I calling the laws of exponents?
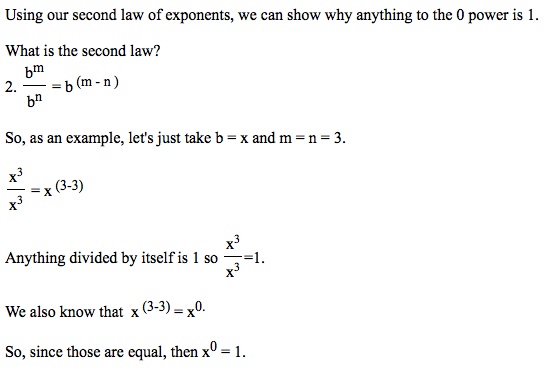
Allow students to use just a regular scientific calculator to input various expressions with natural number exponents. Also, be sure to address the case when the exponent is 0. What does that mean? Again ask the students to try to explain it and verify that all the laws just found still hold. You can actually use the second law of exponents to arrive at the definition of 0 as an exponent. See below.
Then, do the same for negative exponents. Explore negative exponents and show that all the laws still hold.
After this, the natural question is what about fractional exponents???
Again, we are going to use calculators, but this time we will use graphing calculators so that we can see the graph of various function, trace the function, and find particular values.
Let's first start with y =. But instead of just graphing that function immediately, we are going to create lists in the calculator.
So in List 1 (L1) input just the exponents. -2, -1, 0, 1, and 2 should suffice.
And in List 2 (L2) input the expression, 4 raised to each of the powers listed in L1.
Graph the scatterplot. Adjustments might need to be made in the window for optimal viewing. Something around X: -3 to 3 and Y: -5 to 25 will be fine.
After graphing the scatterplot, have the students guess and sketch what the entire function would look like.
Now, graph y =
. Have the students guess what the relationship is (hereby formulating a conjecture for the effect of fractional exponents). The likely response is that it is 2 because 4 x
Graph y =
and test their conjecture again with x =
and see that it matches.
Now, test this last conjecture that
by guessing what
would be when x =
Next, move on to different fractions. For instance, guess how we could rewrite
. Use the graph y =
.
Now, apply the laws of exponents to fractional exponent and verify that they are correct.
Also, introduce fractions where 1 is not the numerator and formulate a definition for that.
Now, let's take a look at negative bases. So what about y =
. Have students try to graph that and then explain why it cannot be graphed (suggestion to use x =
? Have students graph that and observe the transformation from y =
Finally, let's get to the logarithms.
Start with what is a logarithm and how it is read. So
is read the logarithm (or log), in base b, of m is x. At this time, it would be good to note that the base, b, can only be positive... just like exponents. Also, you can mention that when the base is 10, b = 10, the base is not normally written. Thus,
.
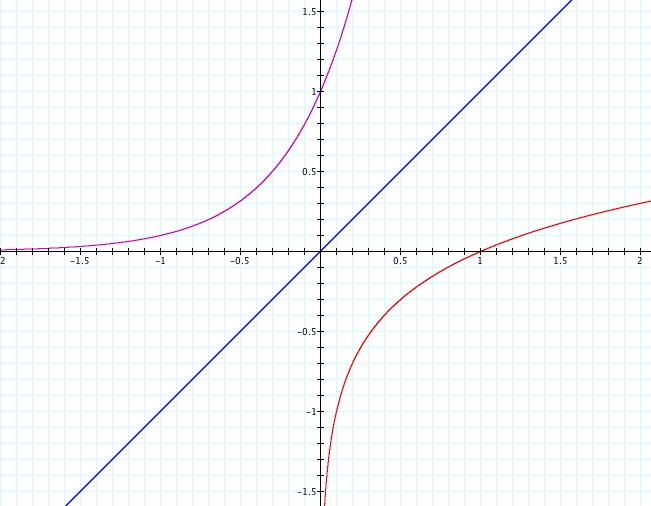
Now, lets get to graphing. Have students graph y =
, y = x, and y =
. Again, note that
Have students discuss the end behavior of the two graphs and identify corresponding points on the pair graphs. For instance, we know that (-1,
), (0,1), and (1,10) lie on y =
.
Once students have identified the connection from the graphs and the coordinates of y =
This should lead to the formal definition of a logarithm. That is that
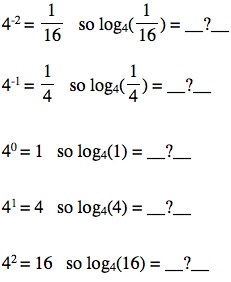
. After this, students should be able to solve simple logarithmic equations like the ones below.
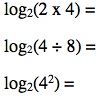
The last thing to do to complete our investigation of logarithms is to identify the laws of logarithms. In this process, the hope is for students to recognize the parallels between the laws of exponents and the laws of logarithms. The laws of logarithms should be explored similar to the way the laws of exponents were explored. Problems similar to the those below can be used to clue students in to the specific relationships they would be looking for.
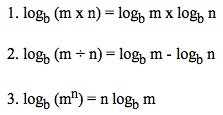
Here are the three laws of logarithms that parallel to the laws of exponents I gave above.
Laws of Logarithms