Investigate the following equations for varying a, b, c, and k.
I chose to investigate the first two equations together, then the second two equations together, and then the last equation. I compared and contrasted the effect that the sine or cosine function had on the graph.
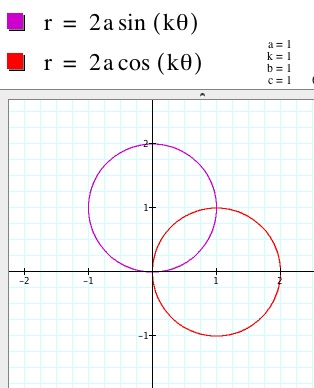
First, I will examine
and
.
1. When a=1 and k=1 both the equations result in circle. The circles have radius of length 1 and pass through the origin. The sine circle is centered at (0,1) and the cosine circle is centered at (1,0).
2. When a varies and K=1, the circles still pass through the origin but the center and radius length change. The radius is
and the center is a on their respective axes. So the center is (0,a) for the sine graph and (a,0) for the cosine graph.
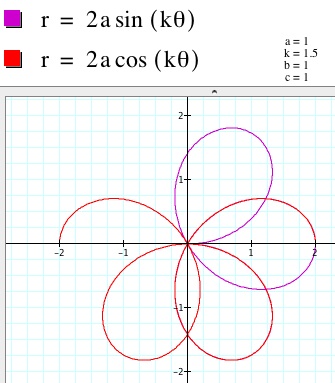
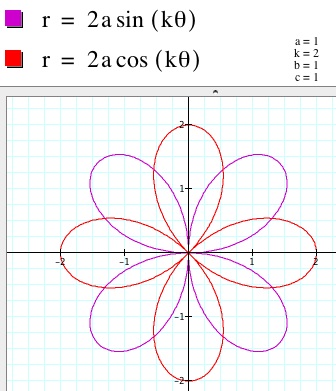
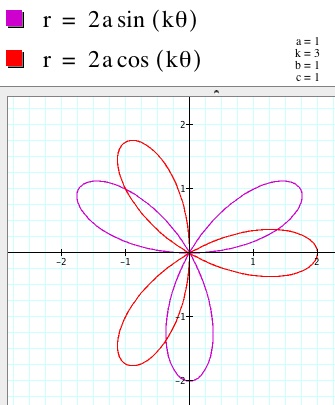
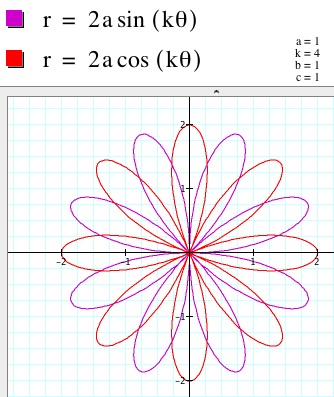
3. When a=1 and k varies but is an integer, the graphs start to look like "flowers." The graphs are sometimes referred to as n-leaf roses. When K is even, the number of "petals" is twice the value of k. When k is odd, the number of "petals" is the same as the value of k. Moreover, when k is odd, the graph of the sine function,
k=2 k=3 k=4 k=5
.
This same relationship holds between even and odd values of k; however, it is harder to see and analyze since the graph does complete the curve or end where it began. Below is an example of what I am talking about when k=1.5. There are 1.5 "petals" on the sine curve and 2 + .5 + .5 = 3 "petals" on the cosine curve.
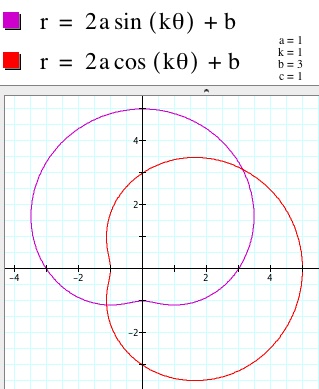
Now, I will discuss
and
.
These equations result in limacons. There are three different sub-categories of limacons: looped, dimpled, and convex.
Looped Dimpled (Cardioid) Convex
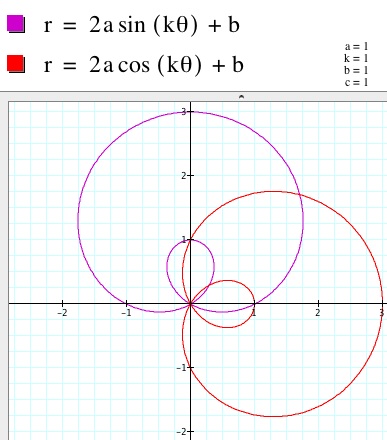
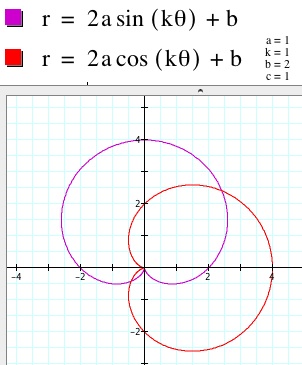
1. When a=1 and k=1 and b varies, we get to see the three different limacons. When 0 < |b| < 2, the graph is a looped limacon. It is a circular looking curve with a smaller loop inside the outer curve beginning at the origin. The graphs are oriented as I described above. The sine curve runs vertically up the y-axis, which it is symmetric to. The cosine curve runs horizontally along the x-axis, which it is symmetric to. The loop decreases in size as it approached |2| and it increases in size as it approaches 0.
When |b| = 2, the graph is a cardioid When |b| > 2, the graph is a convex limacon. There is no longer a loop inside the circle. As b gets larger, the curve appears to approach a circle.
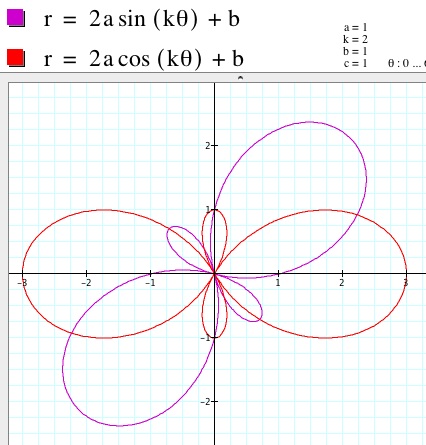
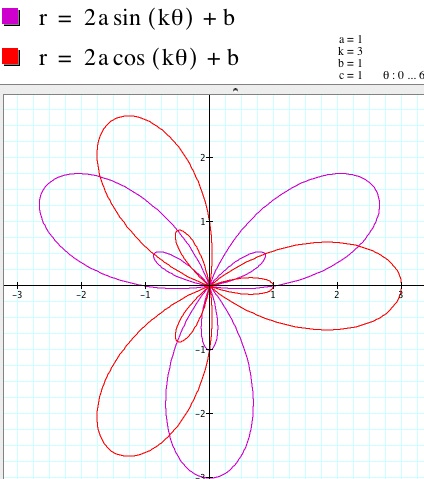
2. When a=1 and b=1 and k varies, there is a drastic change in the graph. However, it is similar to the effect of changing k in the first set of equations. When k is even, there are still twice as many petals as k. However, the inner loop and outer loop that we have talked about earlier separate and act as individual petals. The cosine graph is symmetric to both he x- and y- axes. The sine graph is not symmetric to either axes. When k is odd, there is still the same number of petals as k. The inner loop stays contained within the outer loop and the unit of the combined inner and outer loops act as one petal. The symmetry behaves the same as in the first set of equations. The sine graph is symmetric to the y-axis and the cosine graph is symmetric to the x-axis. See the graphs below for clarification.
k=2 k=3
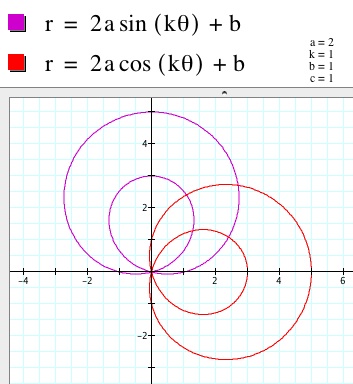
3. When a varies and b=1 and k=1, the general characteristics of the curve are the same. It is still a limacon. There is still an outer curve with an inner loop. The curves are just bigger and extended further along the axes. Just as in the first set of equations, the a affects the "radius" or size of the curves.
a=2
Finally, I will analyze
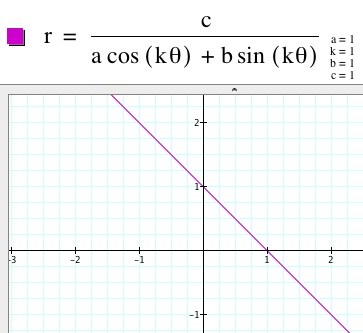
.
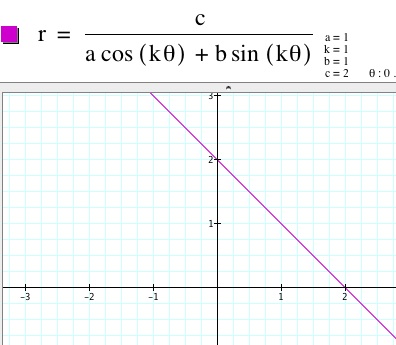
1. When a=1, k=1, b=1, and c varies, the graph is a line through (0,c) and (c,0). The equation of the linen is y=-x+c.
c=1 c=2
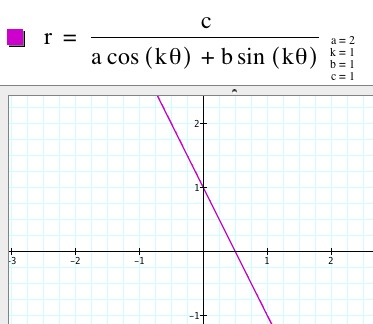
2. When a varies, k=1, b=1, and c=1, the graph is a line through g(0,1) and (a,0). The equation of the line is y=-ax+1.
a=2
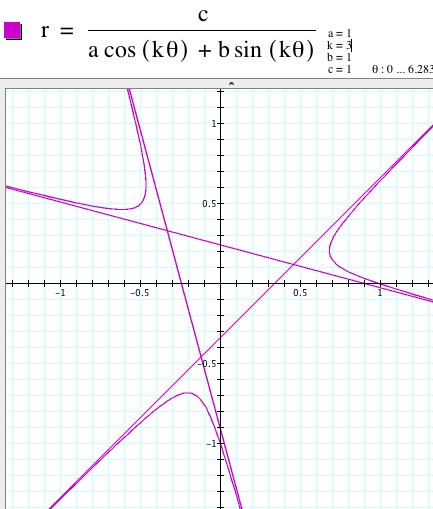
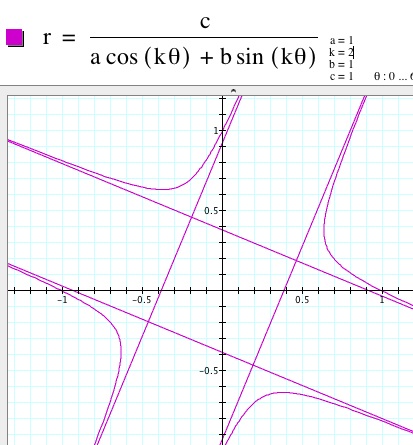
3. When a=1, k varies, b=1, and c=1, the equations establish a series of hyperbolas?? When k is even, the number of individual curves to the graph is equal to 2k. When k is odd, the number of individual curves to the graph is equal to k.
k=2 k=3
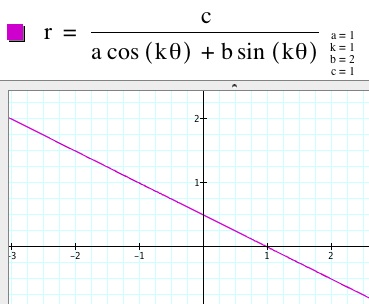
4. When a=1, k=1, b varies, and c=1, the graph is a line through (0, b) and (1,0). The equations of the line is
.
b=2
5. When a varies, b varies, and c varies but k=1, the graph is still a line with the combined effects described above. The equation of the line is
.