I began this assignment thinking that I was going to explore some of the polar equations presented in Assignment 11. However, as I began working with spreadsheets and trying to figure out exactly how it works, I ended up moving in a different direction. I stuck with polar equations but began exploring polygons that I could create within the unit circle using spreadsheets.
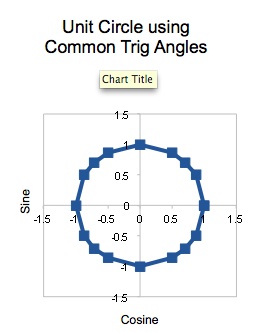
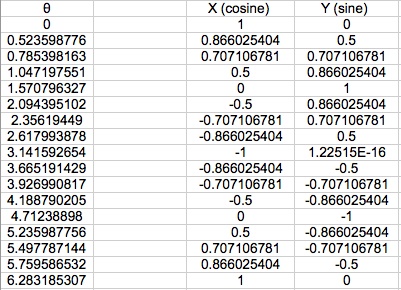
First, I created a unit "circle" using the cosine and sine of the common radian measures. I put circle in quotes because I only used those common angles and, therefore, only had 16 points to define the unit circle with. Thus, the lines that connect these points are indeed lines and not curves.
But first, how did I do all this with spreadsheets??
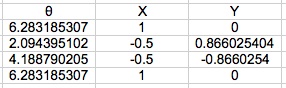
First, I started by entering in the common radian measures that students learn on the unit circle. These were my values for theta. Then, since I was working with the unit circle, I knew that the radius would be 1. I also knew that x = rcos(
) and y = rsin(
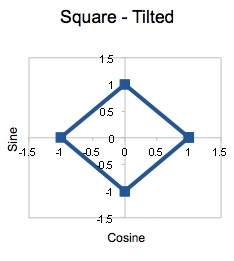
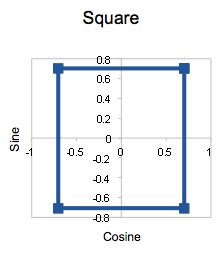
Upon examining this graph, I noticed a square. I recognized that the coordinates corresponding to an angle measure
,where n = 1, 2, 3, 4, would create a square. Then, I entered these into the spreadsheet and got the (x,y) coordinate pairs and made my graph. Upon completing that, I realized that this would work for any 4 points that are evenly spaced around the unit circle.
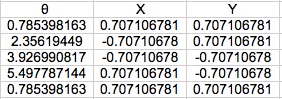
I made the next square by beginning with 2π. Then I divide it by 4 to get my second point. Then, I divided it by 4 but then multiplied that by 2 and so on. This resulted in a square that was tilted. The vertices are on the axes.
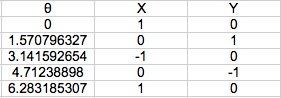
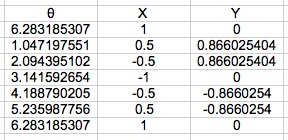
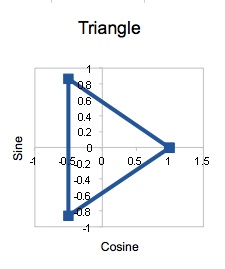
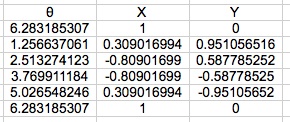
This lead to my next extension. I began seeing more polygons that could be created and by using a more systematic approach. My first approach was a triangle. I began with 2π. Then I took a third of 2π to get another vertex of my triangle. And finally two-thirds of 2π to get the last vertex of my triangle.
As with all the previous examples, I began and ended with the same value. Here 0 is the same as 2π since it results in the same cosine and sine measures. Further, it has the same radian measure on the unit circle. The reason for doing this is purely for the purpose of being able to complete the figure using the spreadsheet. If I would have omitted the last coordinate pair, one line in the polygon would not be drawn.
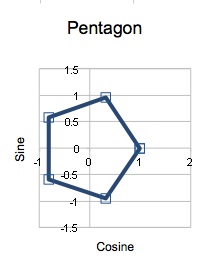
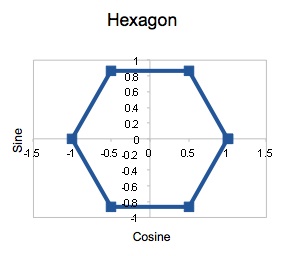
I moved on to a pentagon. And a hexagon.
This whole process can be used to create and regular n-gon:
1. Make the list of your angle measures (theta values). You will want to have the same first and last entry in the list and a notal of n+ entries. This is because you want the lines to complete the polygon. If you do not do the last entry, the polygon will not be complete.
2. I began with 2π for each polygon. So, the general form to fill out each of the entries in the
where n is the number of side in the polygon you wish to create and x = 0, 1, 2, ..., n-1, n. Having x = 0 and x = n results in
3. Then, translate these values for
4. Select the x and y columns and make a graph. You will want to make a scatter plot with the points and lines.
5. Label the axes and title the graph as desired.