
Technology Investigation of Particular Polar Equations
Amena Warrayat
*Please maximize browser to properly view the essay*
This essay will walk through an investigation designed for secondary students to use technology to analyze graphs and describe patterns. It represents an example of student work and then an analsyis of the constructed response to the problem below.
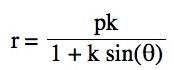
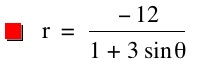
Problem:
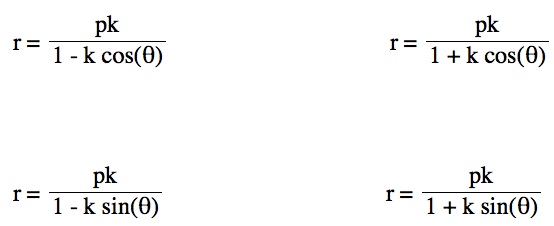
Investigate with different integer values of p and document any patterns. What do you notice happens to the polar equation as the value of p changes? To help with organization, consider the three cases for each equation:
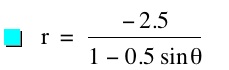
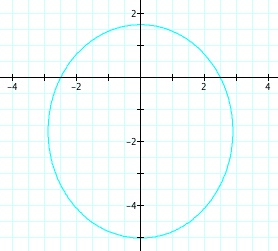
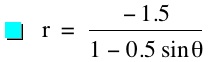
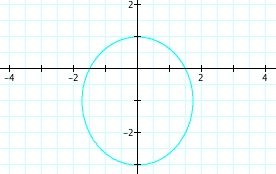
Case I: k < 1
Case II: k = 1
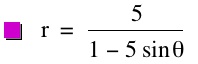
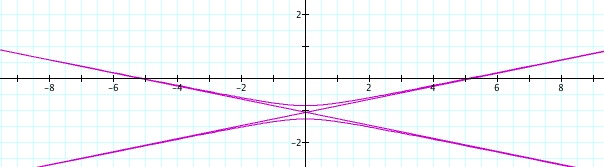
Case III: k > 1
The parameter k is called the "eccentricity" of these conics. It is usually called "e" but for many software programs e is a constant and can not be set as a variable.
Example of student response:
Jump to the investigation of equation: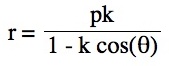

Case I: k < 1
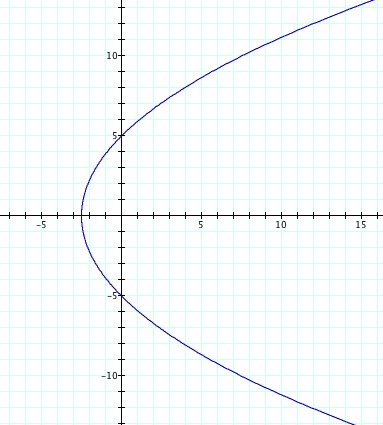
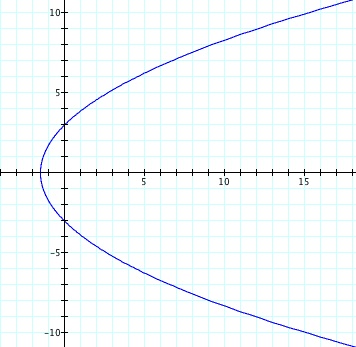
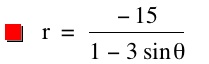
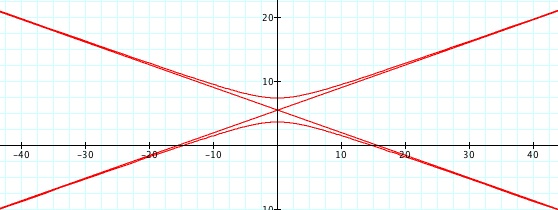
| k = -5 | k = -3 | k = -1 | k = -0.5 | |
|---|---|---|---|---|
| p = -5 |
|
|
|
|
| p = -3 |
|
|
|
|
| p = 1 |
|
|
|
|
| p = 4 |
|
|
|
|

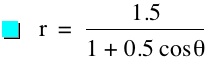
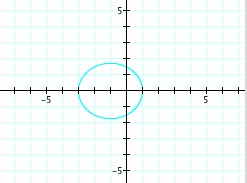
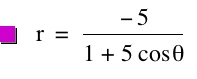
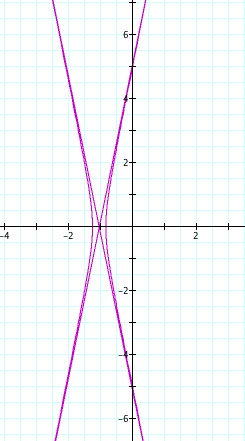
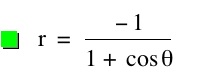
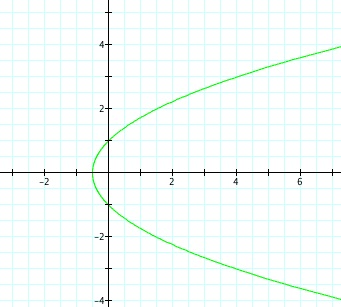
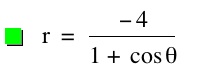
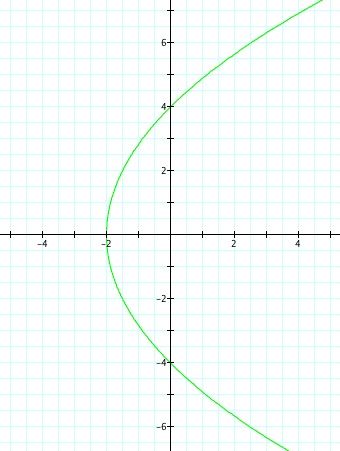
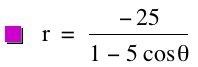
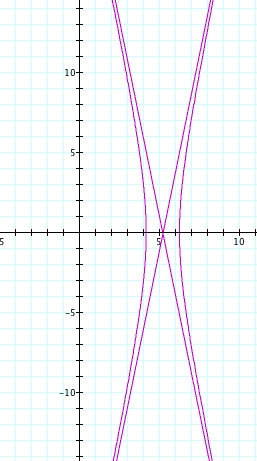
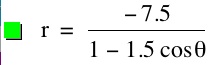
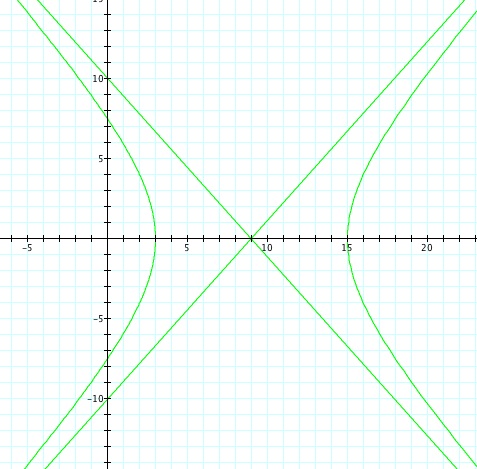
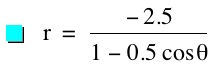
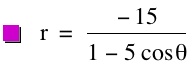
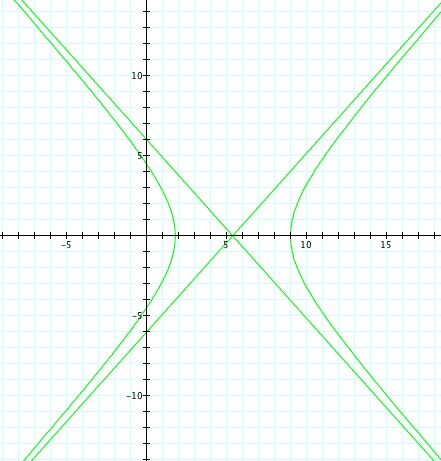
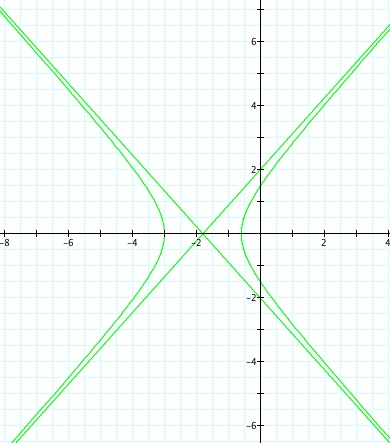
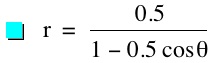
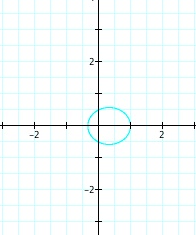
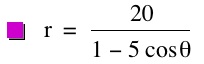
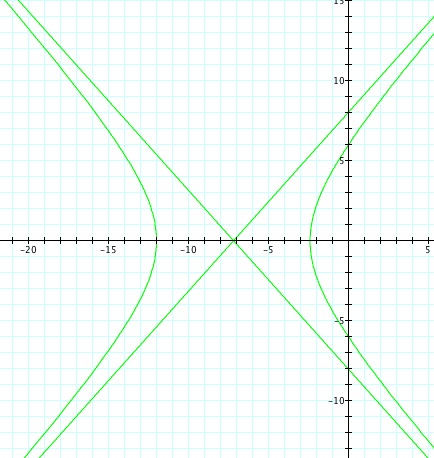
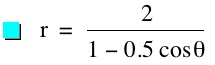
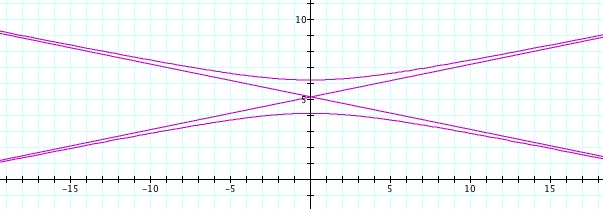
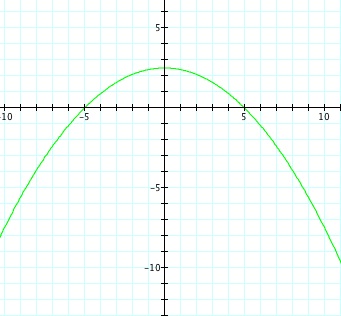
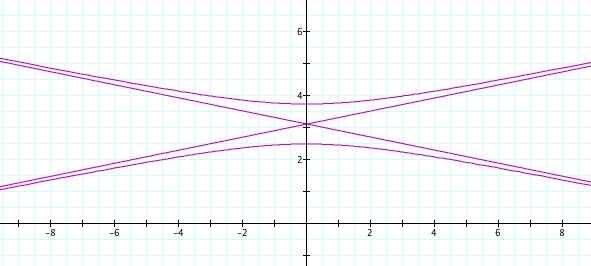
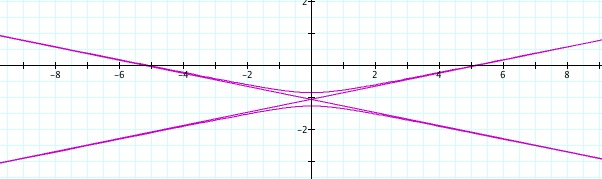
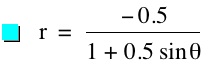
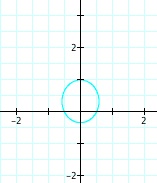
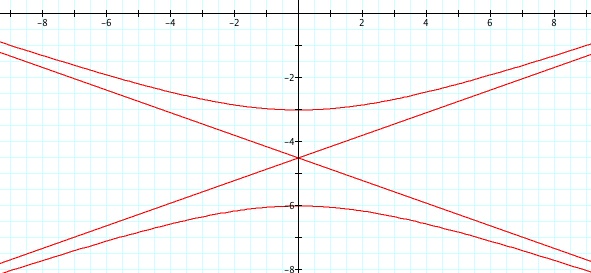
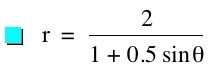
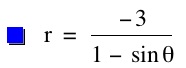
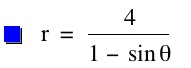
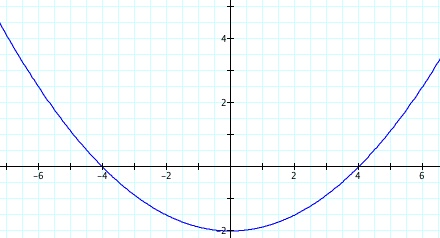
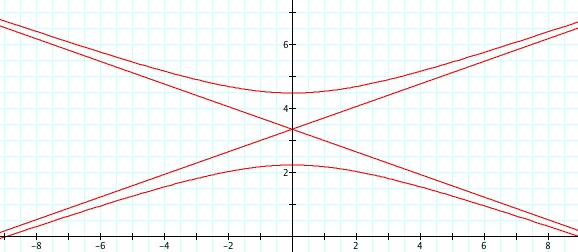
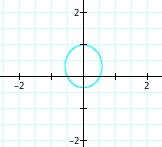
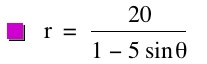
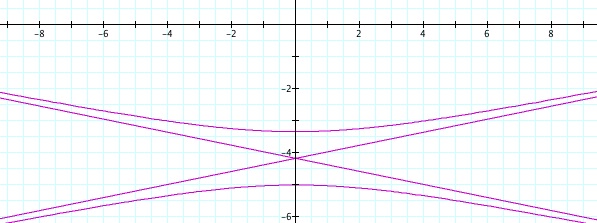
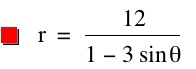
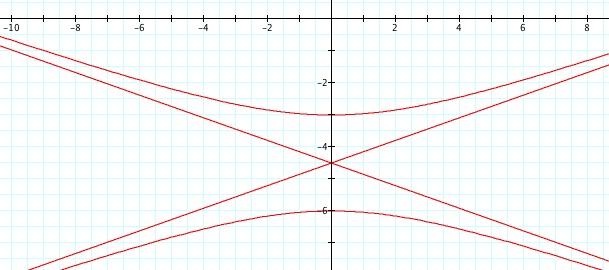
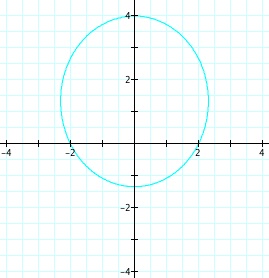
So, when k < -1, and p being any nonzero integer, the graph will be a hyperbola. It is interesting to note that specificall when k = -1, and p is any nonzero integer, that the graph is just a parabola whereas when -1 < k < 1 and p is any nonzero integer, the graph is a circle.
Case II: k = 1
| k = 1 | |
|---|---|
| p = -5 |
|
| p = -3 |
|
| p = 1 |
|
| p = 4 |
|
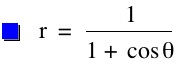
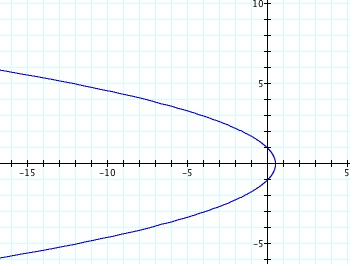
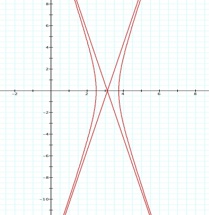
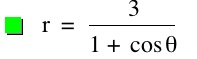
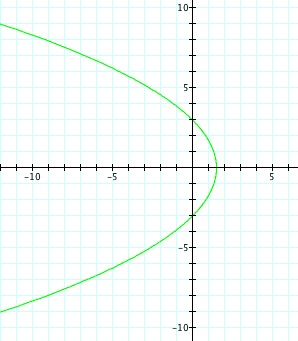
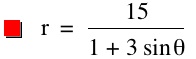
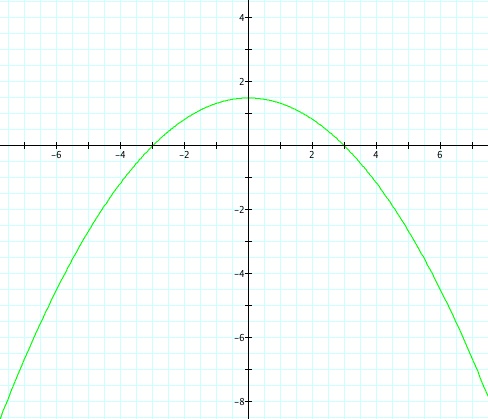
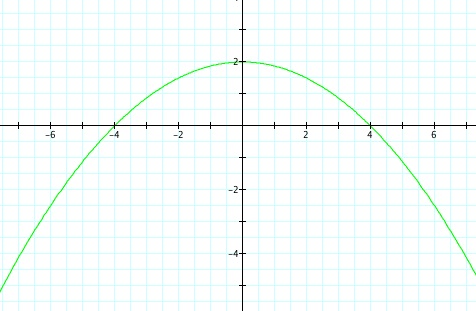
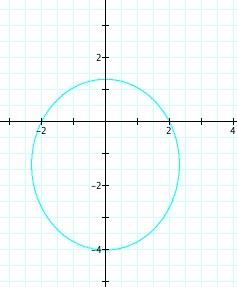
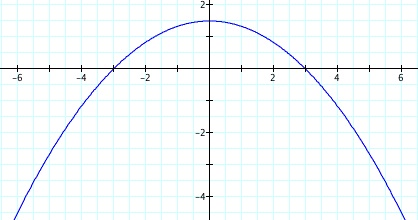
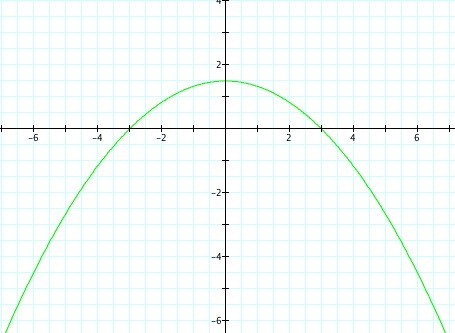
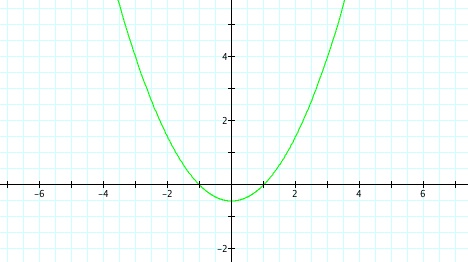
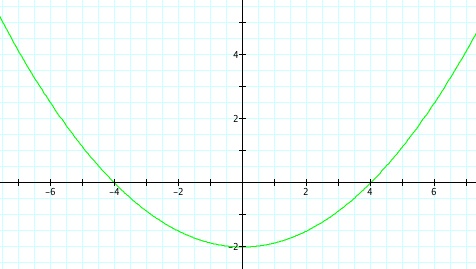
This case is interesting because for any nonzero integer value of p, when k = 1, the graph is a parabola.
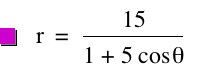
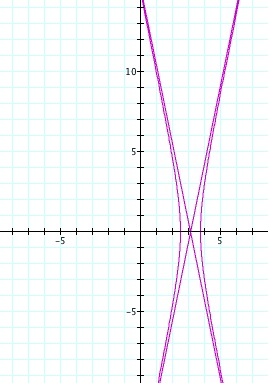
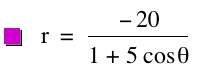
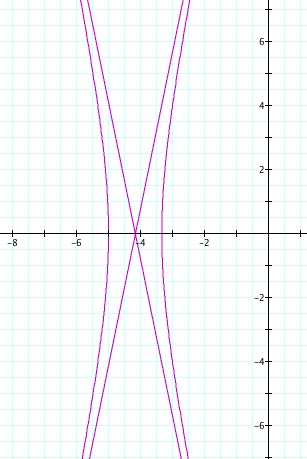
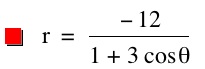
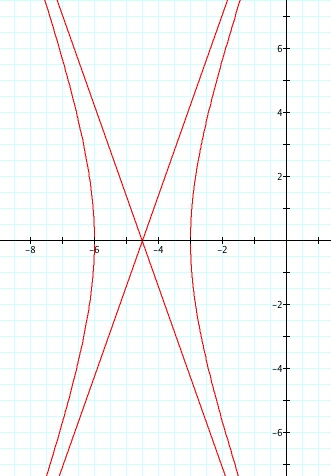
Case III: k > 1
| k = 5 | k = 3 | k = 1.5 | k = 0.5 | |
|---|---|---|---|---|
| p = -5 |
|
|
|
|
| p = -3 |
|
|
|
|
| p = 1 |
|
|
|
|
| p = 4 |
|
|
|
|

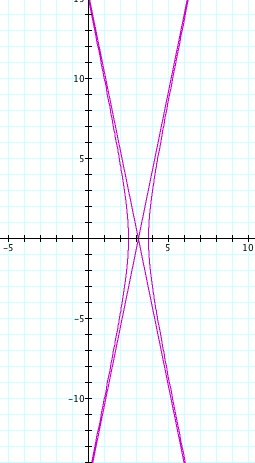
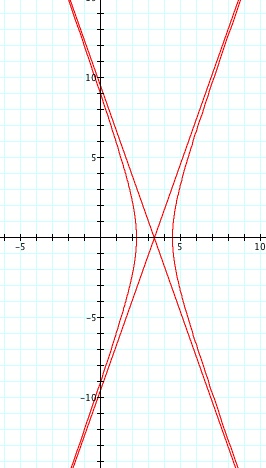
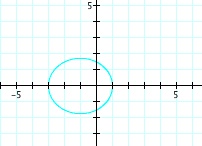
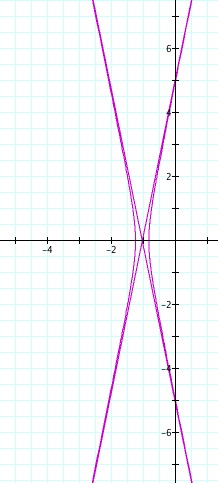
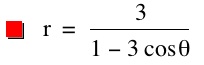
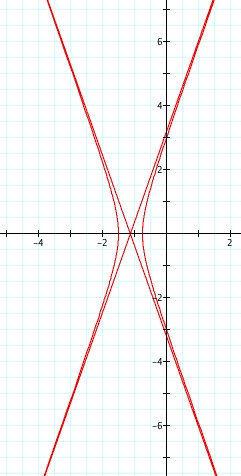
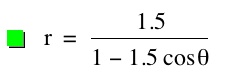
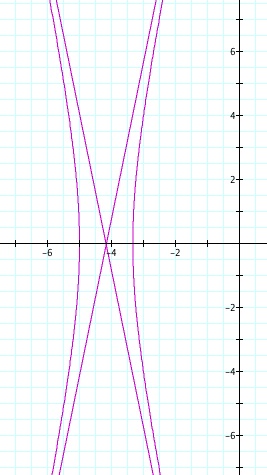
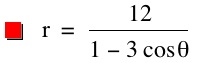
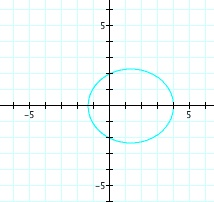
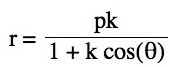
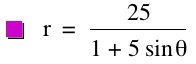
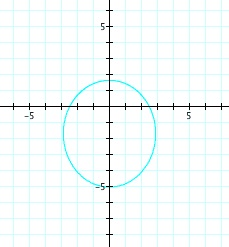
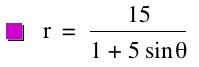
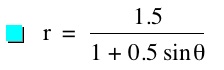
For values of k >1, the graph is a hyperbola, unless -1 < k < 1, where the graph is a circle.
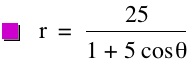
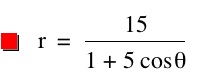
So, comparing this to the previous polar equation; we can formulate the analysis of this equation based on its relationship to the equation just explored. Since the only difference is the addition sign in the denominator, and based on working with the graphing calculator (althougth screen shots aren't provided here), it is clear, that the same inferences will be made. The only change in the graphs of these polar equations is the orientation.
Case I: k < 1
| k = -5 | k = -3 | k = -1 | k = -0.5 | |
|---|---|---|---|---|
| p = -5 |
|
|
|
|
| p = -3 |
|
|
|
|
| p = 1 |
|
|
|
|
| p = 4 |
|
|
|
|
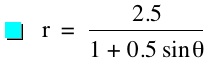
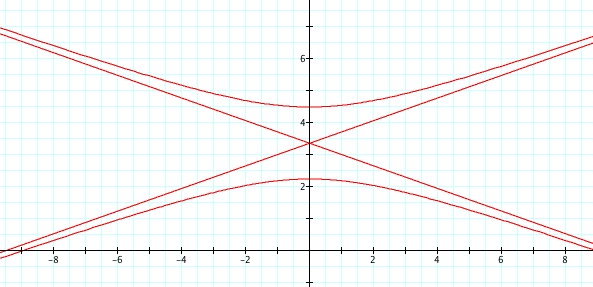
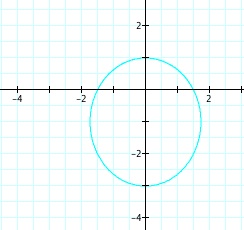
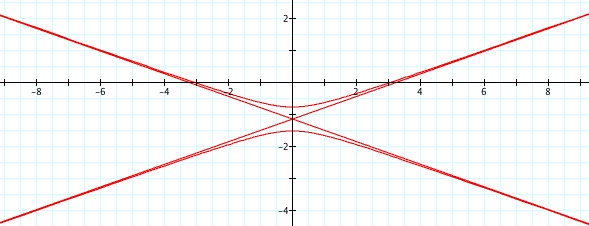

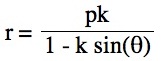
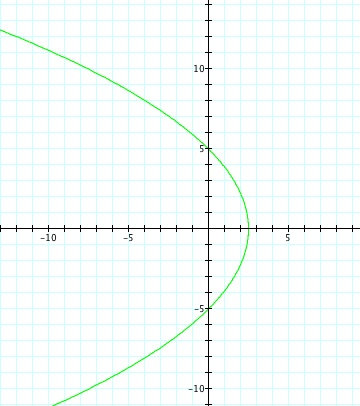
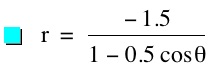
We notice that p is always chosed as a nonzero integer. For the values of k <-1, the equation produced a hyperbola, but it is interesting to note that when k = -1, it produces a parabola and when -1< k < 1, the graph is a circle.
Case II: k = 1
k = 1 |
|
p = -5 |
|
p = -3 |
|
| p = 1 |
|
| p = 4 |
|
For all nonzero integer values of p, when k = 1, a graph of a parabola is produced.
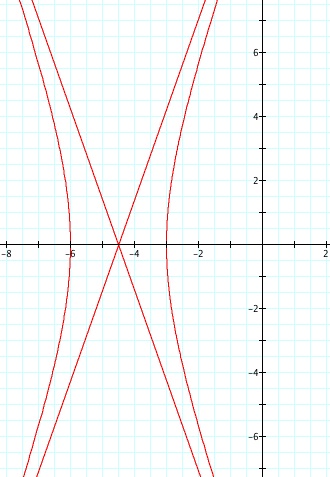
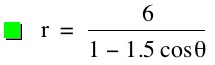
Case III: k > 1
k = 5 |
k = 3 |
k = 1 |
k = 0.5 |
|
p = -5 |
|
|
|
|
p = -3 |
|
|
|
|
p = 1 |
|
|
|
|
p = 4 |
|
|
|
|
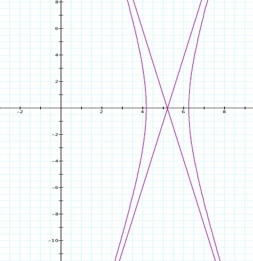
Note that p is always a nonzero integer. When k>1, the graph is a hyperbola, but when k = 1 or is a fraction less than 1, the graph will be a parabola or circle, respectively.
So, comparing this to the previous polar equation, we formulate the analysis of this equation based on its relationship to the equation just explored. Since the denominator has an addition sign, and according to the graphs produced from the graphing calculator software, the graphs would appear the same as in the three cases for the previous equation.
Analsyis of the Constructed Response:
Although the student provided rich graphical representation of these situations, the analysis of the different case were rather short. Instead of providing details within each case on the graph of the polar equation, the student could have discussed the effects within each case. For instance, he or she could have discussed what the differences of p had on the polar equation. What transformations were observed specifically when trying to compare investigations of equation 1 versus equation 2, and equation 3 versus equation 4.