Graphs in the xb Plane
Colleen Foy
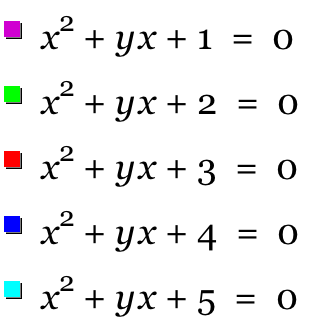
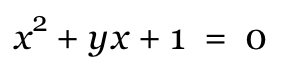
Consider the equation
.
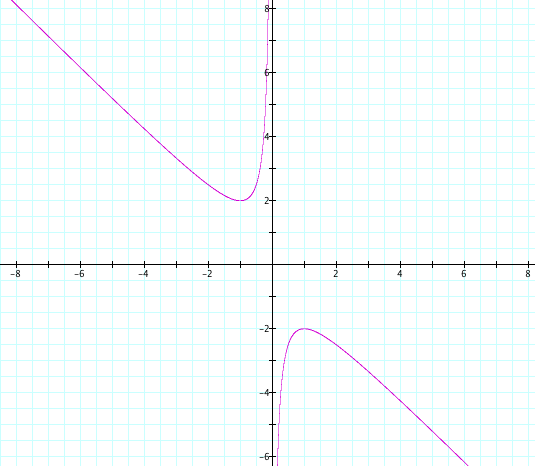
Graphed in the xb plane (note c = 1) this equation looks like this:
Will this always be a hyperbola? If we consider the function, xy = -1 , we know that this is a hyperbola. Now translating this like so, (x - a)(y - b) = -1 it is still a hyperbola. Applying the distributive property: xy - xb - ya + ab = -1. Rearranging this equation, we obtain: xy = xb + ya - ab - 1 = xb + ya - (ab +1). Note xb + ya is a linear factor, and (ab + 1) is just a constant. We know that this is a hyperbola because all we did was translate the original hyperbola. The equation
. So we have it in the form, xy equals some value, thus we know it is a hyperbola.
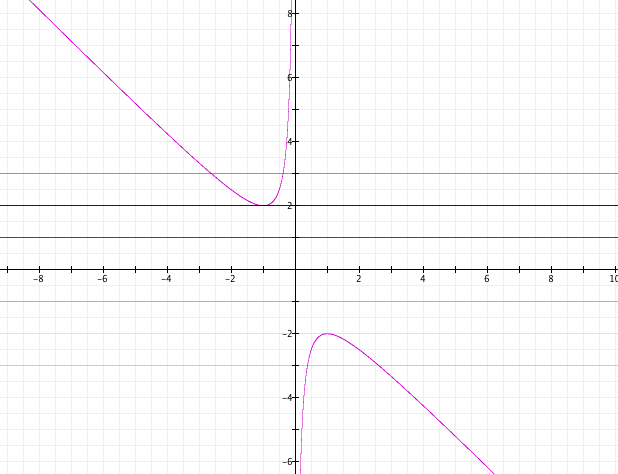
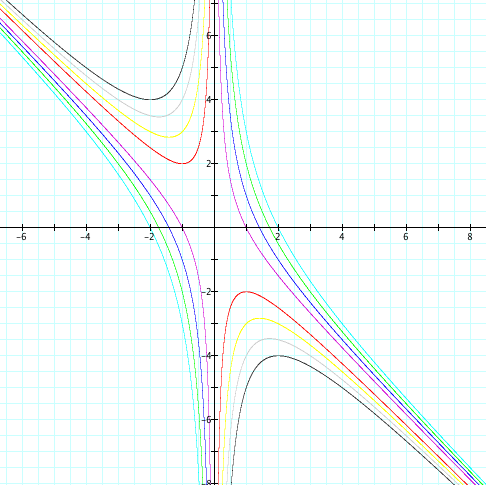
If we graph horizontal lines for different values of b we obtain horizontal lines crossing the curve. Here is a graph with the lines b = -3 , -2 , -1 , 1 , 2 , and 3.
Note that when b = 2 the line is tangent to the curve when c = 1. When b > 2, the line crosses the curve in two points. When b = -2, the line is tangent to the curve with c = 1. When b < -2 The line crosses the curve in two points. Where these lines intersect the curves represent the roots on the original equation in the xy plane. So when b = 2 we have one positive root and when b = -2 we have one negative root. When b > 2 we have two negative roots and when b < -2 we have two positive roots. There are no real roots when -2 < b < 2.
Can we prove this?
Conjecture: The quadratic equation
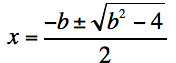
Proof: The solutions to the quadratic equation
When b = 2 we obtain x = -1. When b = -2 we obtain x = 1. When -2 < b < 2 or |b| < 2 ,
< 4 and we have a negative underneath the radical which would result in no solution. When |b| > 2 then
The asymptotes of the above graph are y = -x and x = 0. As b increases, the roots approach the asymptotes. They move away from the line y = -x. As b becomes more negative, the roots shift away from the asymptotes.
Now we can make multiple graphs for multiple values of the constant c. The following graph displays the graphs for
c = 1 , 2 , 3 , 4 , and 5.
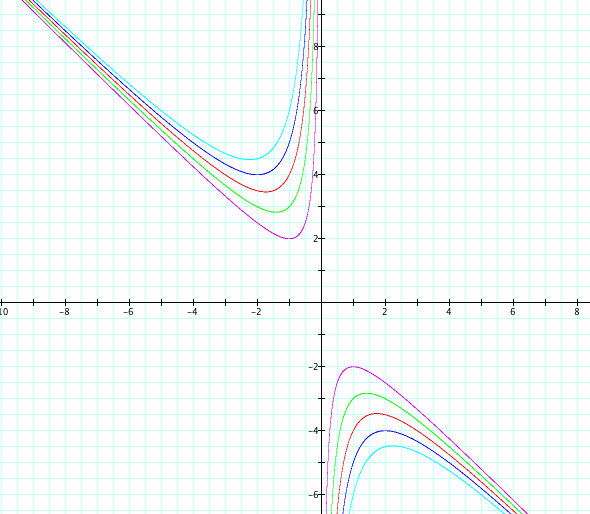
Note that there are asymptotes at x = 0 and y = -x. As c approaches infinity, the hyperbola moves away from the asymptotes. As c approaches 0, the hyperbolas move towards the asymptotes.
Consider what happens when c = -1 instead of c being positive.
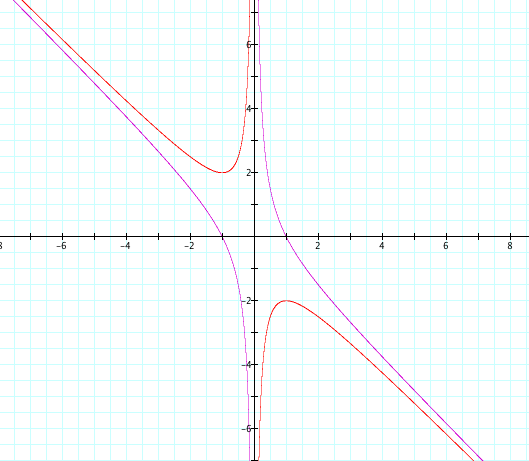
Here is a graph with c = -1 in the xb plane:
Here is the graph with both equations included (c = 1 , c = -1):
Taking multiple values of c we obtain a family of hyperbolas:
Note that when c = 0, we have the equation:
which corresponds to the line through the origin with with slope -1. This is an oblique asymptote for the family of hyperbolas above. The hyperbolas also have the vertical asymptote x = 0.