
Parametric Equations
Colleen Foy
For this assignment we will explore parametric equations using graphing calculator. Recall that a parametric curve in the plane is a pair of functions: x = f(t) and y = g(t) where the two continuous functions define ordered pairs (x,y). The two equations are usually called the parametric equations of a curve. The curve depends on the range given for t.
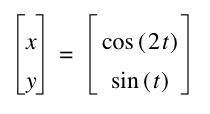
For this specific assignment we are going to investigate the following parametric equations for various a and b :
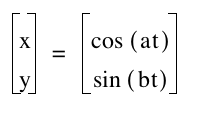
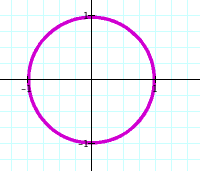
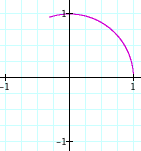
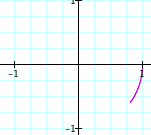
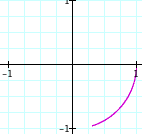
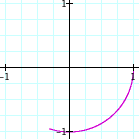
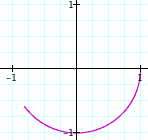
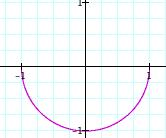
Here is a graph of the curve when a = 1 and b = 1. Note that our range for t is ![]()
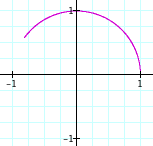
Let's examine what happens when we take other values of a and b but keep them equal. Will we always obtain a circle?
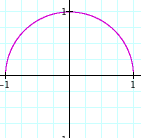
When a = 2 and b = 2 When a = 10 and b = 10 When a = -1 and b = -1 When a = 145 and b = 145 When a = - 50 and b = -50
So when a and b are integers and a = b we obtain a circle. Well what happens when a = b but a and b are not integers?
Case 1: 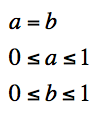
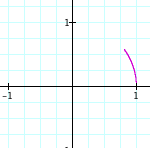
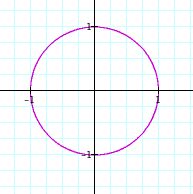
a = b = 0.1 a = b = 0.2 a = b = 0.3 a = b = 0.4 a = b = 0.5
Case 2: 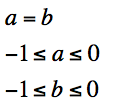
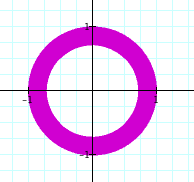
a = b = - 0.1 a = b = - 0.2 a = b = - 0.3 a = b = - 0.4 a = b = - 0.5
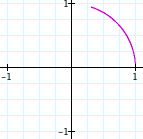
Case 3: 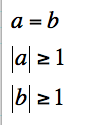 Again in this case we see the circles as we did when a and b were integers.
Now, let's look at what happens when ![]()
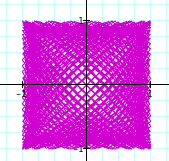
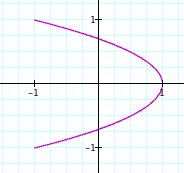 a = 2 and b = 1 gives us a parabola. Actually, I found that this is the case whenever b = 2a.
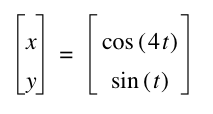
 a = 4 and b = 1 or whenever b = 4a.
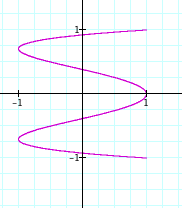
 a = 8 b = 1 or whenever b = 8a
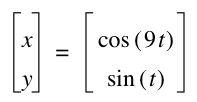
Here we can see a pattern. As n increases, and ![]() the graph increases in frequency.
the graph increases in frequency.
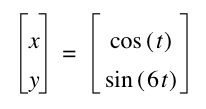
Note that this was for when b could be written as a even multiple of a. What happens when their factor is odd?
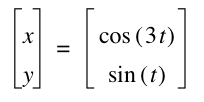
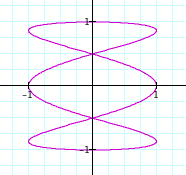
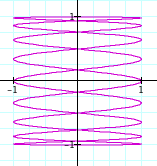
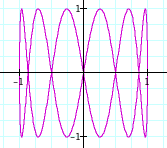
When b is an odd factor of a, we can see that the graph connects and there are no breaks of stopping points. Also, as the factor between a and b increases, the frequency increases just as we saw before.
Note that the odd factors seem to have the same properties as the even factors. That is for example, that the graph when a = 3 and b = 1 is the same graph as when a = 9 and b = 3.
What happens when a is odd and b is even?
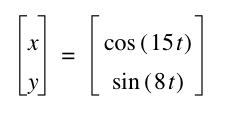
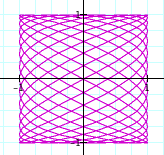
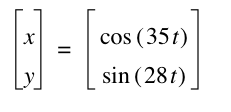
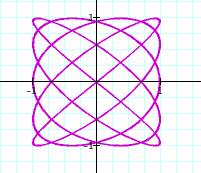
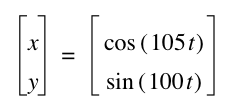
 It seems that as a and b increase, the frequency increases. The graph where a = 35 and b = 28, seems different from the patter however. I wonder if this could be due to the fact that they share a common factor of 7...
Now let's look at what happens when ![]() :
:
The patterns appear to be the same, except now the graphs lie horizontally on the x-axis instead of vertically on the y-axis.