by Donny Thurston
1. Investigate
Note:
- When a and b are equal, and k is an integer, this is one textbook version of the " n-leaf rose."
- Compare with
for various k.
In this write-up, we are going to explore polar equations. We are going to examine what they really are and how they work, as well as why the "n-leaf rose" described above works the way that it does.
In addition, we are going to look at any unusual behavior, and see if we can actually explain it, instead of just saying, "well that just happens because we see it happen."
Lets start with the actual behavior of the polar coordinate system:
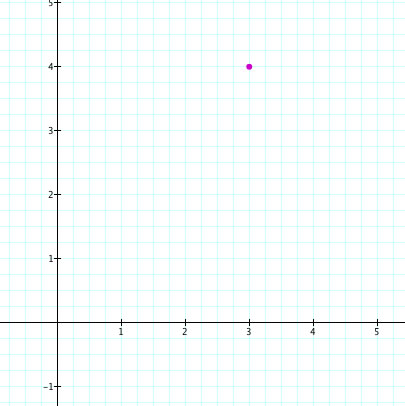
In the Cartesian coordinate system, we designate a point by using two axes, and indicating a value for one of each of the axes: see the point, (3,4) here:
Equations draw lines or curves by describing the relationship between a range of values on each of the axes.
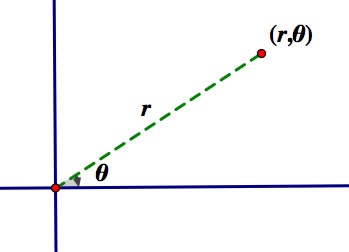
For the polar coordinate system, however, we only have one axis, usually referred to as r. We plot points by indicating one value for r, and an angle measurement (in this write-up, done in radians, named Theta). r represents the distance the point is from the origin, and the angle measurment is the angle from the ray heading to the right of the orgin (representing an angle of 0 radians, as seen in the unit circle) to the point, using the origin as a vertex. Observe:
In the polar coordinate system, equations represent the relatonship between θ and r. Therefore, the equation will usually indicate how r (the distance the point is from the origin) varies with respect to θ, or the location of the point around the origin, which typically ranges from 0 to 2pi.
Polar equations can give us some fascinating curves, but it can often be hard to conceptualized how the curve was created. Therefore, we are going to take some of the basic equations seen in our problem, and analyze why they represent the pattern that they do.
A couple of rules to remember as we explore these equations:
1. r is a single value, and is the only axis on the graph (despite the fact that we will often see graphs with two drawn axes). When we see two axes, they are both r, because r is the distance between the origin and our point (or curve).
2. θ is our "input", as well as our "location" around the origin. If we set the range of θ from 0 to 2pi, then we are going to go all the way from 0 to 2pi, no matter what operations occur to θ. It may be multiplied, or result in an r = 0 value several times, but we are going to "get all the way around" the origin in some form if θ goes from 0 to 2pi.
Let us start with the first equation from our problem:
equations of the form r = a + b cos(kθ)
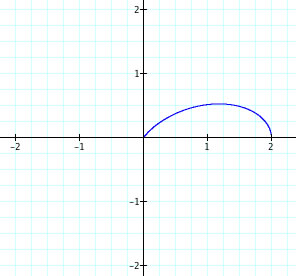
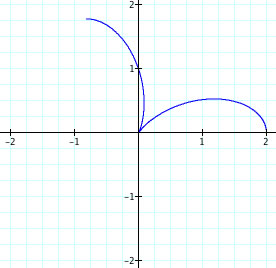
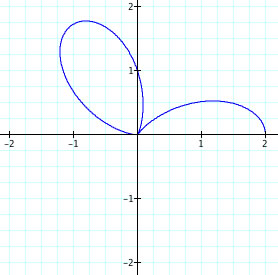
Let set a and b equal (as per the problem) to 1, and see some values of k vary. θ will go from 0 to 2pi.
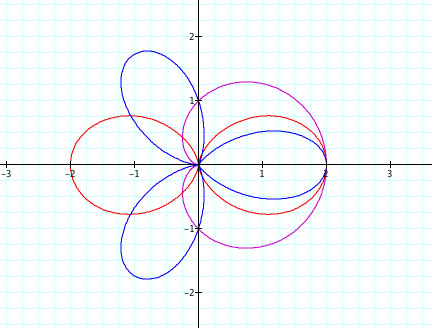
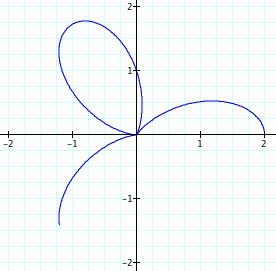
r = 1 + cos (kθ)
k = 1 in purple; k = 2 in red; k = 3 in blue
I did not put too many on there at once to avoid confusion, but we are able to see a clear pattern rise. Does it continue?
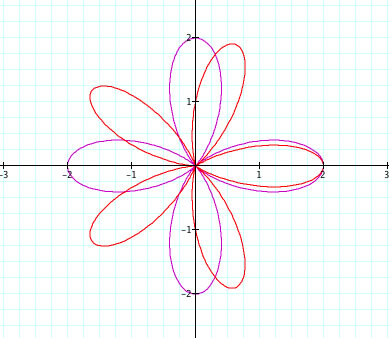
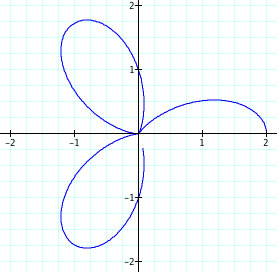
r = 1 + cos (kθ)
k = 4 in purple; k = 5 in red
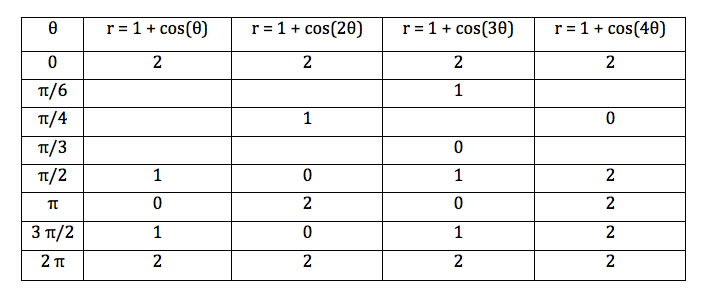
It appears so. It seems that we have created the k-(or n-)petal flower! But why does it work this way? What exactly is going on? I suggest that we can go to a table of values, and remember how polar equations work, to see how this works. Remember that r is the distance that a point (or a particular point on a curve) is from the origin. Therefore, every time the curve crosses the origin, that represents a moment when r is equal to zero. We can observe this in action when we study how θ interacts within the cosine function:
To calculate the various values of r, it is a simple matter of plugging in the θ. I did not include all of the values in the table, but instead wanted to display some important critical points. Go and compare the values in the table with the two graphs. Do you see how all of the points make sense? So why does the n-petal flower have n petals?
To answer that, think about how many times 1 + cos(kθ) hits zero. Recall that cos(θ) ranges from -1 to 1, when θ ranges from 0 to 2pi, with -1 occuring once in that range. Since -1 occurs once, then 1 + cos(1θ) = 0 once. However, cos(2θ) hits -1 twice as θ ranges from 0 to 2pi. Similarly, cos(nθ) hits -1 n times as θ ranges from 0 to 2 pi. Since we create a petal every time 1 + cos(kθ) = 0, then we will always create k petals.
Also note that 1 + cos(kθ) is never negative. This is true despite the fact that cos(kθ) can be negative. But because it is never less than -1, the expression cannot be negative. We will see how this is important in the next section of this write-up.
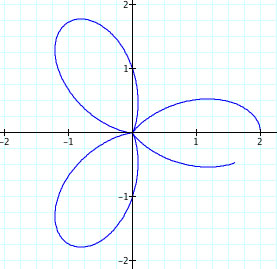
What is worth understanding is exactly how the graph is constructed. The line is not always drawn intuitively. For instance, looking at the graph of r = 1 + cos(3θ), we may assume that someone took a pencil, started in the center, and draw three looped shapes. But instead, recall that the curve "starts" (θ = 0) at the value r = 2! That is, the curve moves in and out from the origin, but still follows a steady counter-clockwise path around the origin!
Observe: (first image θ ranges from 0 to 1, second 0 to 2, and so on until 0 to 6 in the final image)
So then what about:
How is that different from :
Lets take a look.
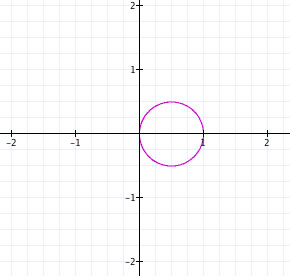
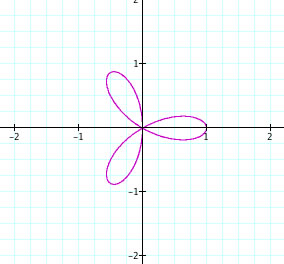
r = cos(θ)
Well, that is simple. For starters, it has smaller values of r than does the previous function. This makes sense as we no longer have a constant added to inflate r. The curve never appears to enter the second or third quadran either. This is odd, seeing how we have already established that θ must range from 0 to 2pi, and so must make it "all the way around" the origin. Let us examine the same function to see what happens when θ ranges from 0 to pi:
Its the same figure! Why?
Recall that cos(θ) is negative on the intervale pi/2 to 3pi/2. Note that this is the same interval where it appears that we do not have any representation of the graph (second and third quadrant). We aren't see no graph, however. What we are seeing is a negative r, whose values coincide with the positive r. However, the negative r, means that the point is on the other side of the origin from the angle θ. Which means that as θ goes from pi/2 to 3pi/2, r and -r follow the same path on the graph! We actually have 2 petals, but the two petals overlap!
Do the two petals makes sense in light of our previous findings? Yes they do. Remember that we decided that we have a petal every time r = 0, in these equations. While 1 + cos(kθ) = 0 for one point (kθ = pi) when θ ranges from 0 to 2pi, cos(kθ) = 0 for two points (kθ = pi/2, kθ = 3pi/2).
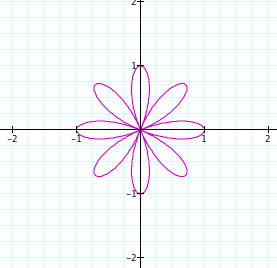
So, we may say that for equations of the form r = cos(kθ), we have a flower of 2k petals (although we may have overlap).
Does the pattern hold up? When do we see overlap?
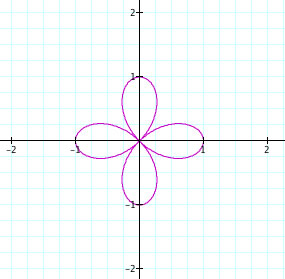
r = cos(2θ)
r = cos(3θ)
r = cos(4θ)
The pattern that we are seeing is that when k is even we have 2k petals, but when k is odd, we only have k petals. However, what is really hapenning here is that when k is odd, the two petals overlap since cos(kθ) can produce negative values, when before it could not because of the constant. The reason being? Because when k is odd and θ = pi (halfway from 0 to 2pi), cos(k) = -1, which put the graph back at the same point as r = 1. [Note that the polar coordinate (1,0) = (-1,pi)]. The rest of the graph (from pi to 2pi) just repeats itself.
However, when k is even, the cos(kθ) = 1when θ = pi, which is on the oppositve side of the origin. The rest of the graph (from pi to 2pi) follows the same pattern but mirrored, created an entired different set of loops, resulting it twice as many as before.
An interesting product of all of this? You can't create a 2, 6, or any 4n + 2 sided petaled flower with the polar equation r = cos(kθ), if k is an integer.