Final Part B: And in That Tree, There Were Some Boards...
By Kendyl Wade
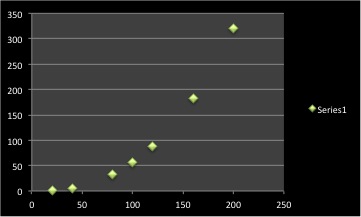
Tree data!
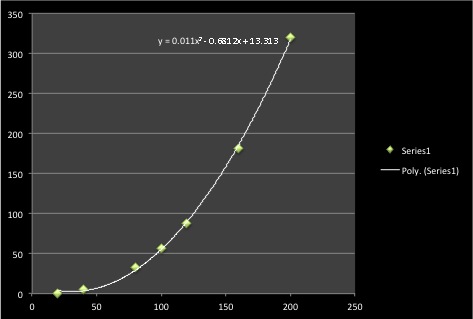
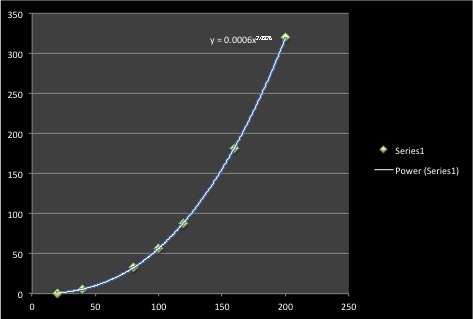
From looking at the scatter plot, the data looks like it would best be fit by a quadratic equation. So first I used excel to fit the data with a polynomial line of order 2 (a quadratic equation). Then, I tried the other forms of fit and the power equation also seemed to fit the data well.
Next I used the data where all the information was given to see how far off the equations were from the actual data.
SSE = 8.25
SSE = 11.72
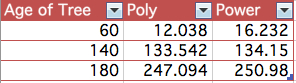
If we compare the SSE for both equations, the quadratic equation would be the better predictor because it has the smaller SSE.
So the quadratic prediction equation would predict about 12 boards for a 60 year old tree, 134 boards for a 140 year old tree, and 247 boards for a 180 year old tree.
The power prediction equation would predict about 16 boards for a 60 year old tree, 134 boards for a 140 year old tree, and 251 boards for a 180 year old tree.
In a company, it would probably be better to underestimate the number of boards you could produce, so looking at the predictions I would still recommend the quadratic equation.
Here is the excel sheet with all my data, tables, and graphs.