Exploring Exponential Functions
by
Mallory Thomas
Examine the graphs of
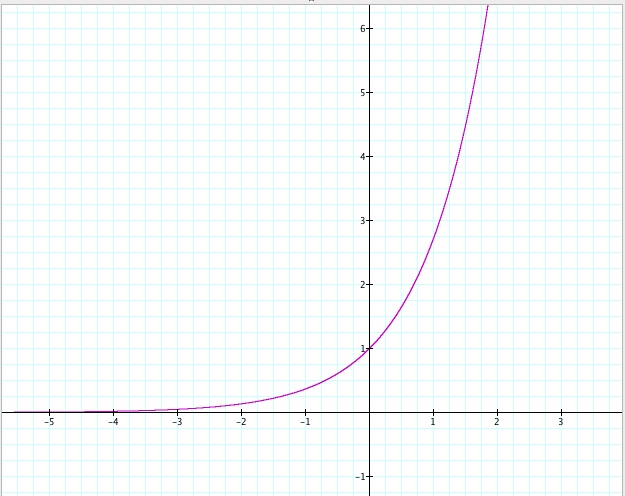
To examine the different aspects of the expontential function, we first need to look at the parent function. The parent function is
Below is a graph of the parent function.
The parent function has a y-intercept of 1. The left end behavior approaches y=0, as the x values approach negative infinity. The right end behavior approaches infinity as the x values approach positive infinity.
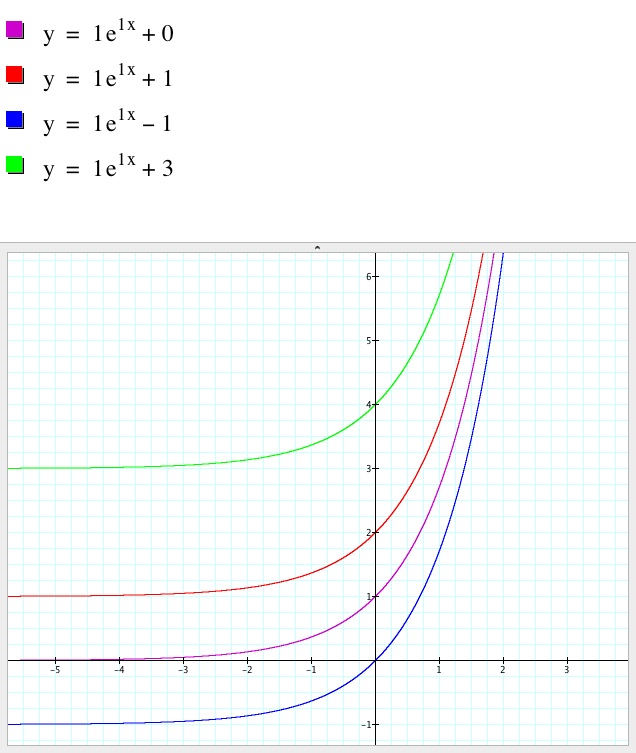
Now, we can begin to manipulate different aspects of the exponential function to see how they affect the graph by comparing it to the parent graph and function. First, we can manipulate the parameter c. For this purpose we will leave the a and b values at 1.
We can note that for the different values of c the y-intercept of graph was moved up or down the y-axis. When the parameter c is positive the y-intercept moves upward, or in the positive direction. When the parameter c is negative the y-intercept moves downward, or in the negative direction.
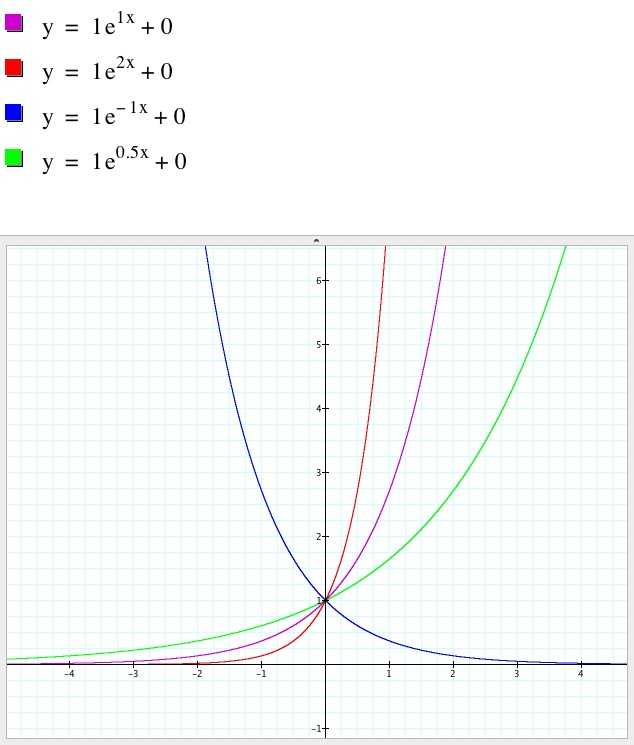
Now, we can manipulate the parameter b. For this we will leave the a equivalent to 1 and c equivalent to 0.
We can note that the different values for b affect the steepness of the graph. When b is greater then 1 the graph becomes more steep. When b is less than 1 the graph become less steep. We also see that when b becomes negative the graph is reflected across the y-axis.
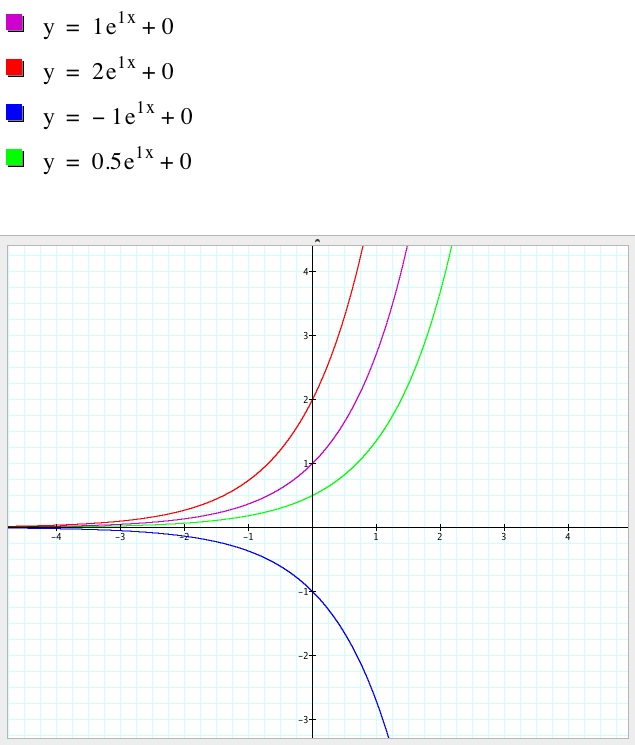
Now, we can manipulate the parameter a. We will leave the value of b equivalent to 1 and the value of c equivalent to 0.
We can note that the different values of a affect the graph. The positive values of a that are greater than 1 move the y-intercept in the positive direction. When the value of a is positive, but less than one, the y-intercept moves in the negative direction. When the value of a is negative the graph is reflected over the x-axis.
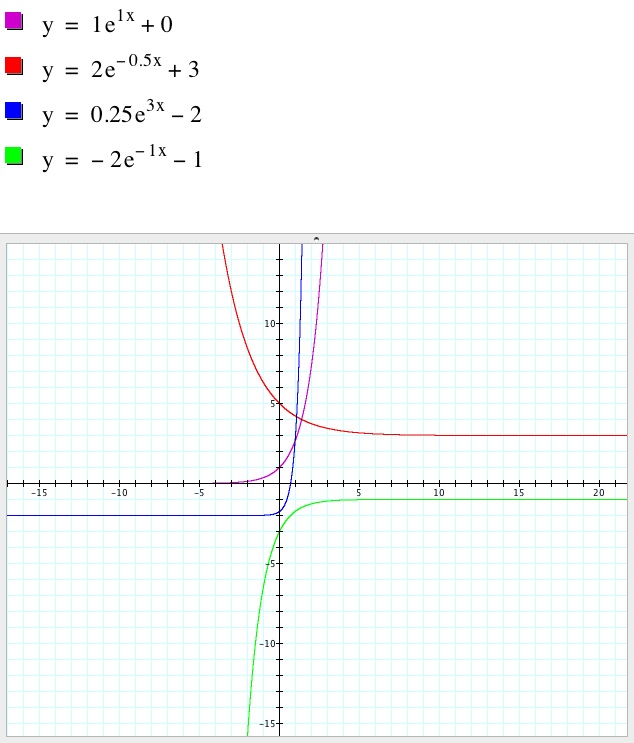
Now, what happens when we manipulate the parameters a, b, and c together.
Here we can see how all three variables work together to display different representations of the exponential function.
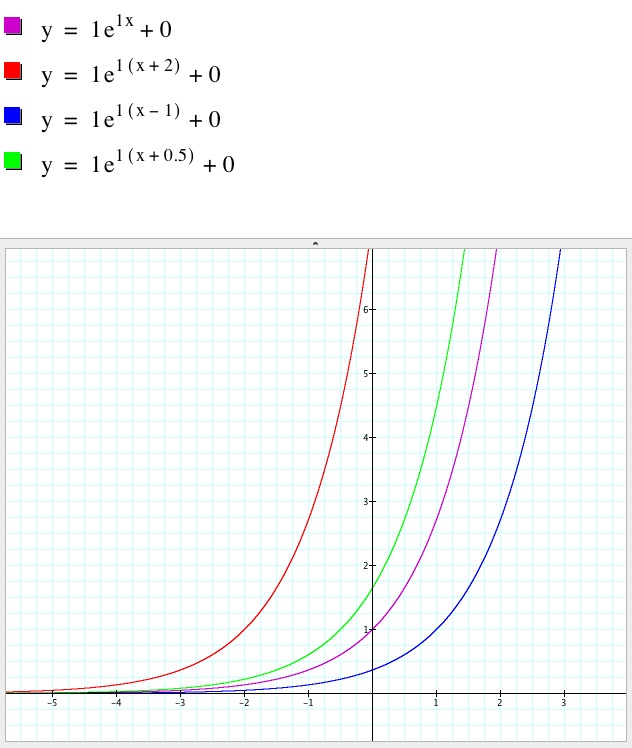
What if we define a different value d?
When we explore what manipulating d does to the graph we will keep the value of a and the value of b equal to 1 and the value of c equal to 0.
We can see that the value of d moves the graph in the positive or negative x-direction. When d is positive the graph moves in the negative x-direction. When d is negative the graph moves in the positive x-direction.