Write-Up #12
Mathematics with Spreadsheets
By Jaepil Han
3. Use the spreadsheet to graph equations in polar form. Try some of the examples from Assignment 11.
All the investigations followed below are made with MS EXCEL.
To do this, first of all, making rows in the very first column as a theta of my spreadsheet by increasing 0.01 until reaching 6.28. This gives us 628 rows by increasing 0.01 from 0.00 to 6.28, as a 2*π.
Second, putting the equation to calculate the value of r.
Third, since (x, y) = (rcos(θ), rsin(θ)), making two more columns of x and y to convering a polar-form to the Cartesian coordinate plane.
Last, making a scatter plot of the last two columns, x and y.
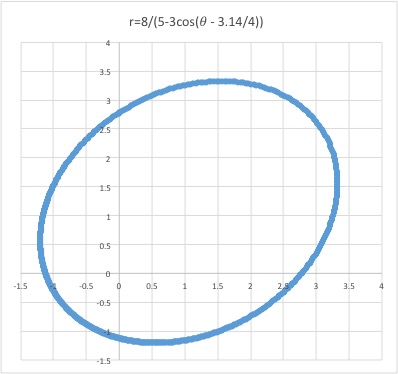
Example 1. ![]()
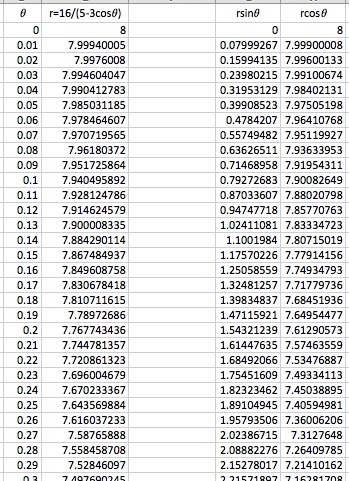

It looks like an ellipse that has a x-axis as its major axis. To verify this conjecture, we need to convert the equation into the Cartesian coordinate form.
Here's the MS Excel file for Example 1.
Example 2. ![]()
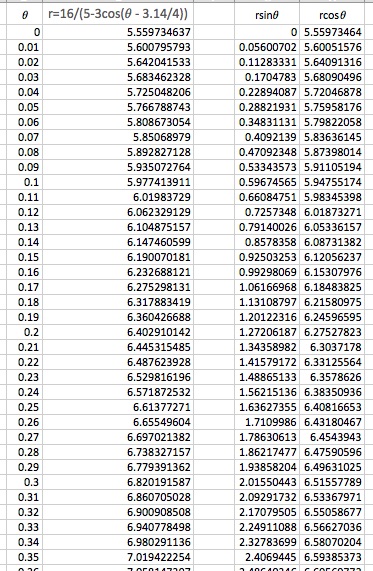
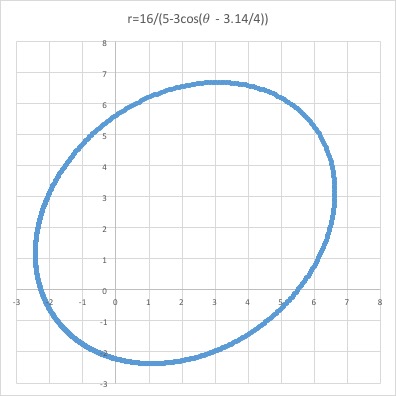
It looks like another ellipse that has a positive-sloped line as its major axis.
Here's the MS Excel file for Example 2.
As an exercise, I do several extensions of the Example 2.
Example 2-1.
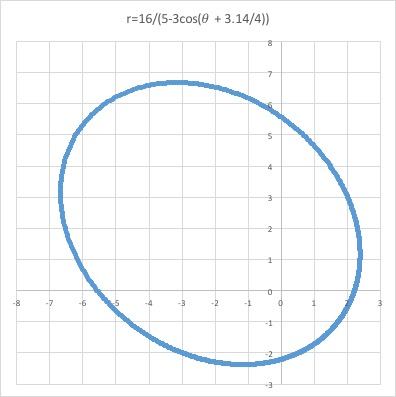
The 8 makes the graph smaller. It seems that the numerator of the equation affects the size of the graph. Here's the Excel file for Example 2-1.
|
Example 2-2.
When we replace the subtraction by addition, the result graph looks like a reflection of the originial graph by y-axis. Here's the Excel file for Example 2-2.
|
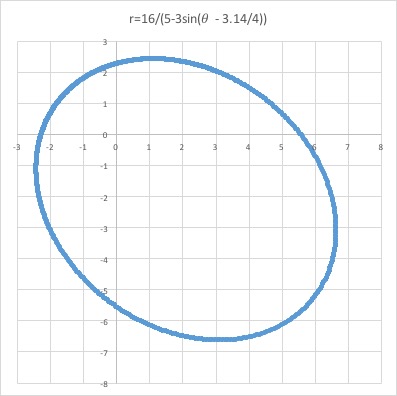
Example 2-3.
When we replace the sin by cos, the result graph looks like a reflection of the originial graph by x-axis. Here's the Excel file for Example 2-3.
|
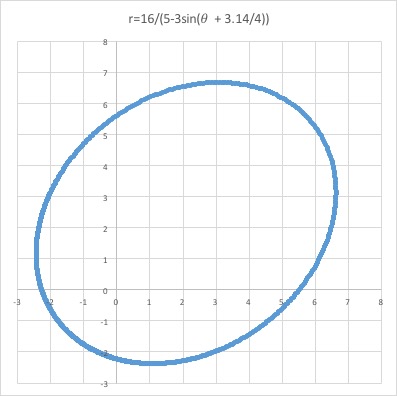
Example 2-4.
When we replace the sin by cos and the subtraction by addition, the result graph looks like a reflection of the originial graph by x-axis. Here's the Excel file for Example 2-4.
|