
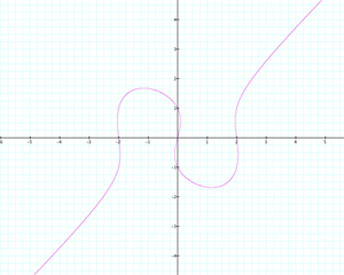
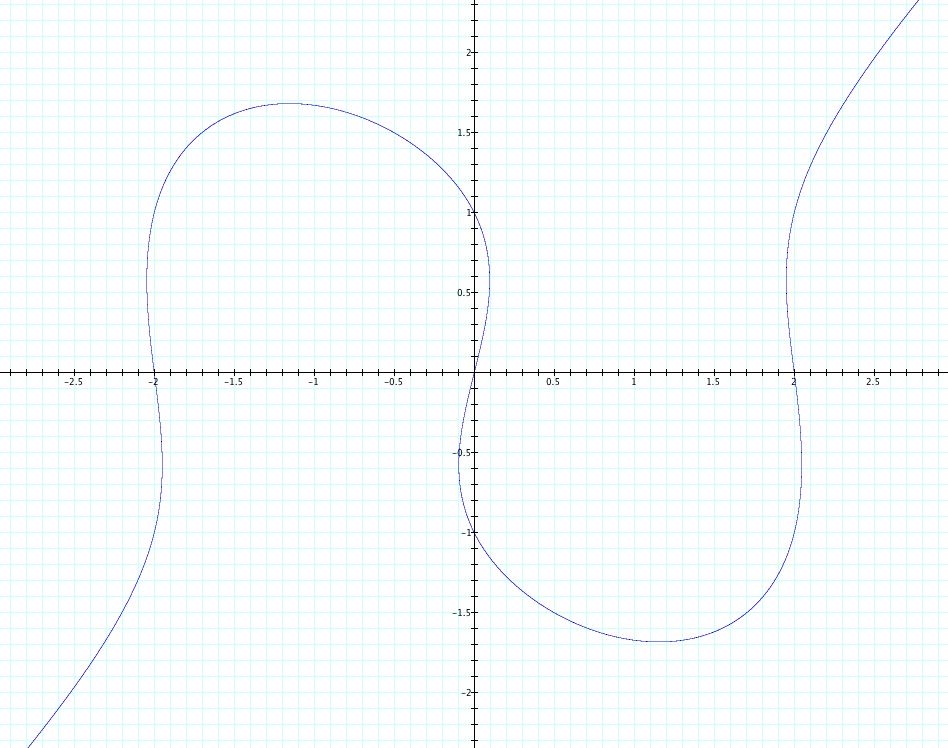
Consider the relation x(x2 - 4) = y(y2 - 1) whose graph appears to the right.
(Click here for a larger image)
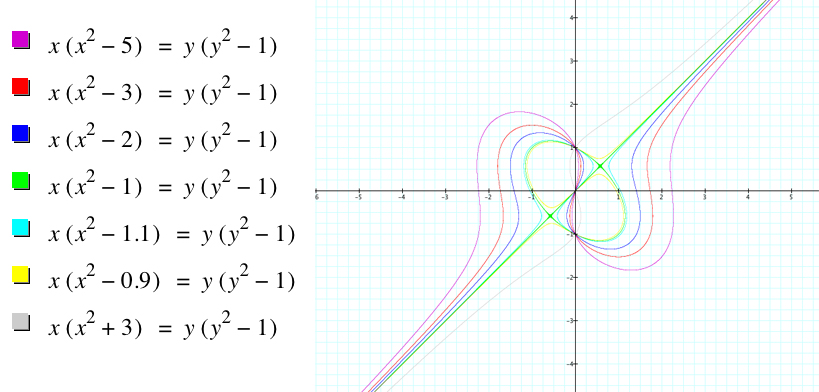
Suppose we were to replace the 4 on the left side of the equation with other values, like 5, 3, 2, 1, 1.1, 0.9, and -3. The graph below shows each of these cases:
Consider the special case of the relation x(x2 - 1) = y(y2 - 1) shown in the graph below:
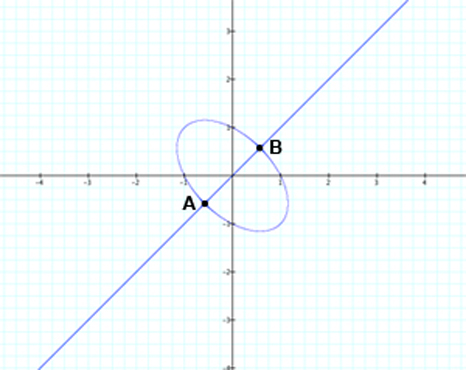
For this case, the graph has 2 nodes, marked A and B. If we examine the equation for this relation, we notice that it can be factored:
x(x2 - 1) = y(y2 - 1)
x(x2 - 1) - y(y2 - 1) = 0
x3 - x - y3 + y = 0
x3 - y3 - x + y = 0
(x - y)[(x2 + xy + y2) - 1] = 0
Giving x - y = 0 and x2 + xy + y2 - 1 = 0, or
the line y = x and the ellipse x2 + xy + y2 = 1 as seen in the graph. The line and the ellipse intersect at points A and B as shown.
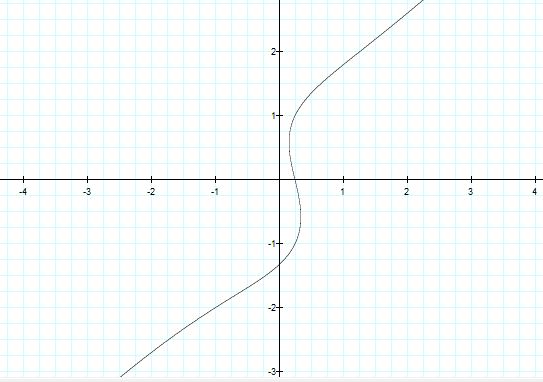
What happens if we add a constant to the right side of the equation? Below is the graph of x(x2 - 4) = y(y2 - 1) + 1:
Now, let's examine the graphs of x(x2 - 4) = y(y2 - 1) + c, where c = -5, -4, -3, ... , 3, 4, 5:
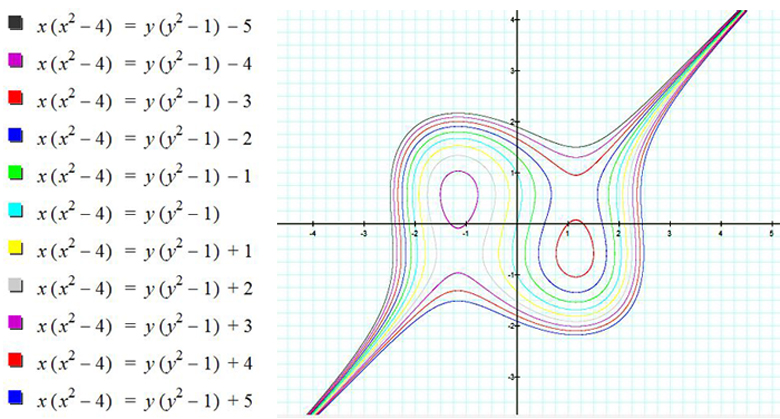
Click here to see an animation of x(x2 - 4) = y(y2 - 1) + n for -5 < n < 5.
The equation above can be re-expressed as x(x2 - 4) - y(y2 - 1) = z, and we can look at the results for various values of z. For example, below we see the graphs of x(x2 - 4) - y(y2 - 1) = z and z = 1:
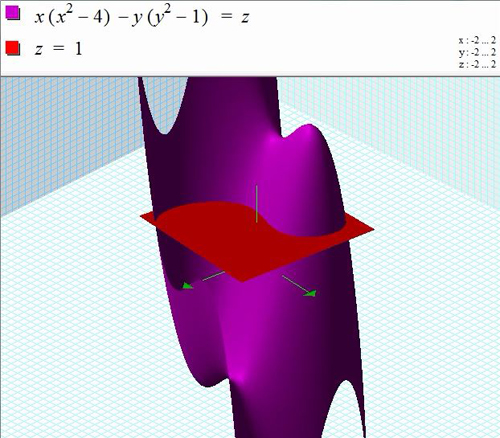
Notice that for each value of z, a horizontal plane intersects the 3D graph creating a cross-section (as seen from above, ie. viewing the 2D graph in the x y plane).
Recall from our earlier exploration that the 2D graph of this relation splits into pieces around the point where the constant on the right is about 2.7 (and -2.7). This can be seen in the cross section as z moves from 2 to 3, and the plane gets above the relative minimum of the 3D surface.
Click here to see an animation of this phenomenon.
We could start with a graph containing nodes, for example two lines that intersect, as with the graphs of y = x and y = -x as seen in the graph below:
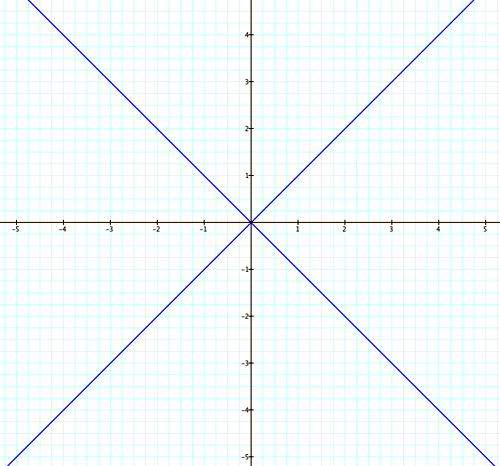
The equations for these two relations can be rewritten as x - y = 0 and x + y = 0, so that their product gives the relation (x - y)(x + y) = 0, which has the same graph.
Because this relation can be factored, we expect that the graph will have a node (we knew this in advance because we started with the graph).
Since this relation has only one parameter (the "0" on the right), let's see what happens when we change the "0" to various different values. The graph below shows this result:
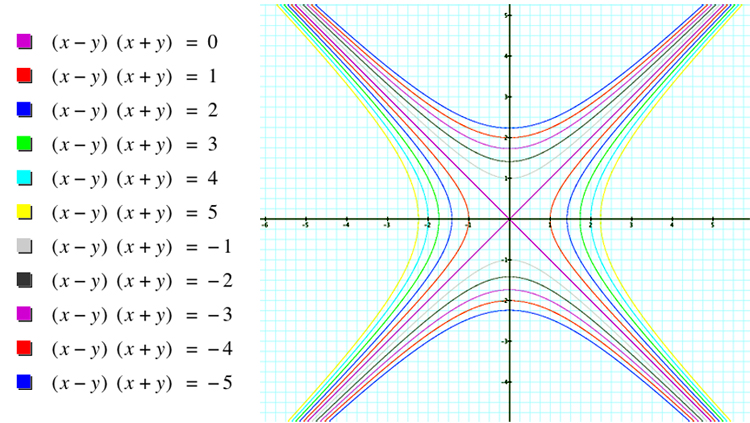
Each of these graphs appears to be a hyperbola with the lines y = x and y = -x as the asymptotes. This can easily be verified by multiplying out the left side of the equation and dividing the result by the constant on the right side, giving, for example, x2/4 - y2/4 = 1, which is the standard form of the equation of a hyperbola centered at the origin with asymptotes y = x and y = -x. In the case of a negative constant on the right side of the equation, x2 and y2 are reversed, yielding a vertically oriented hyperbola.