
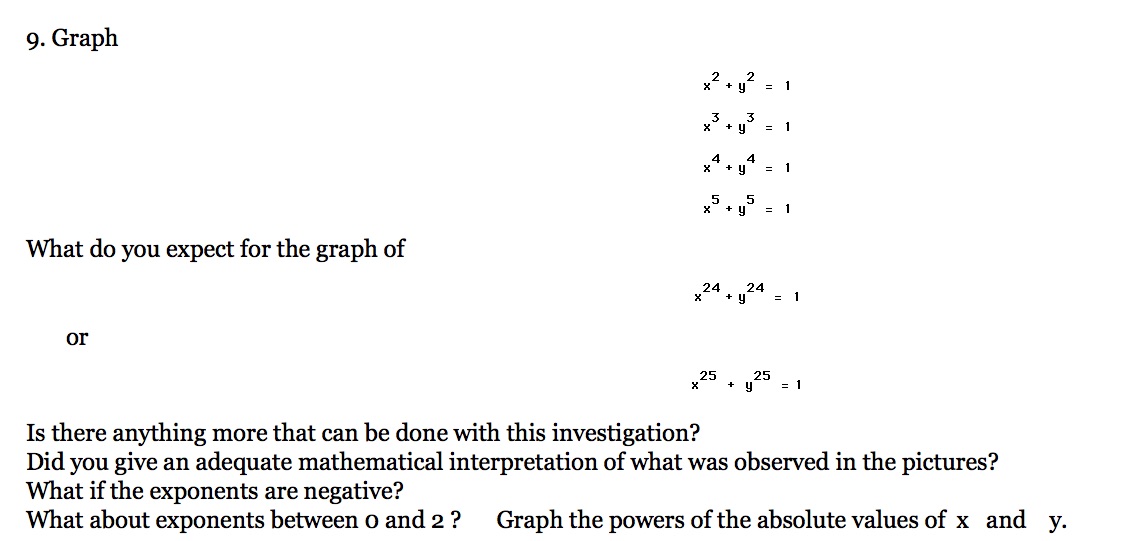
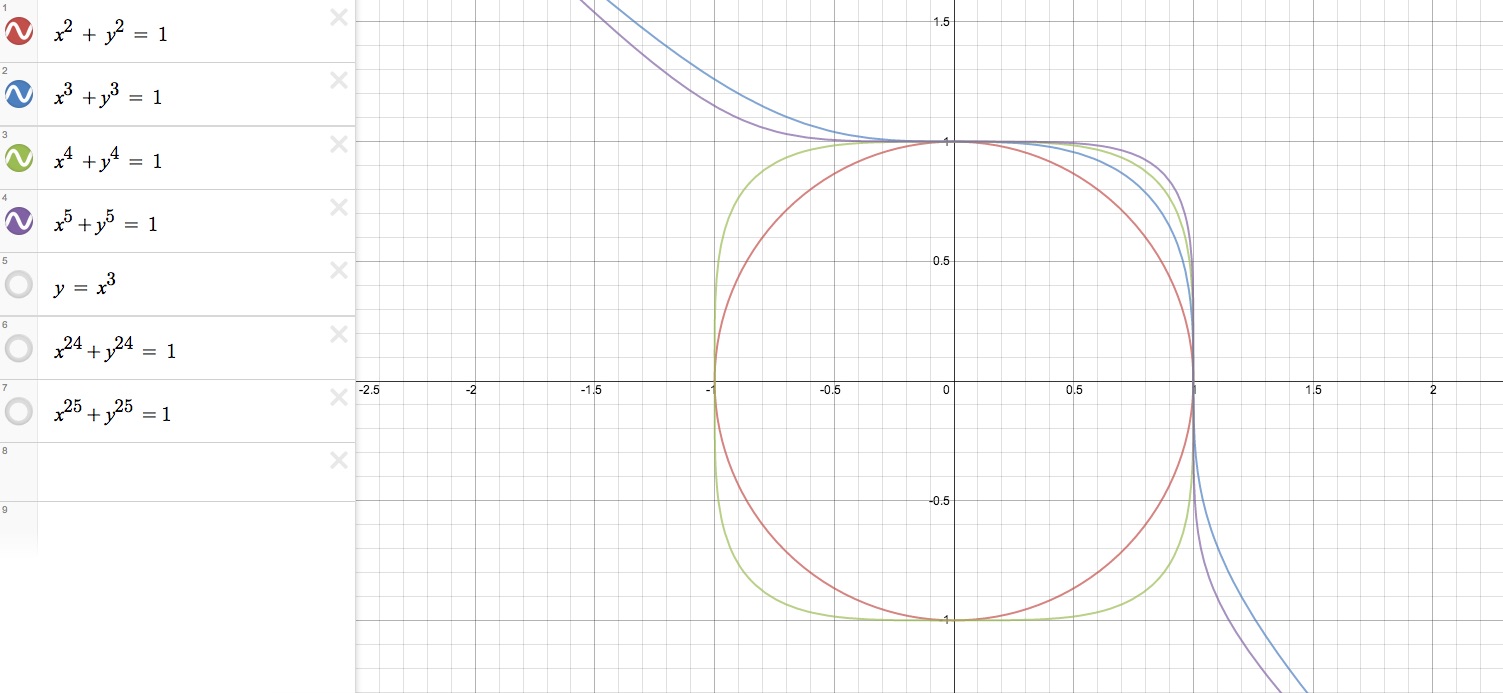
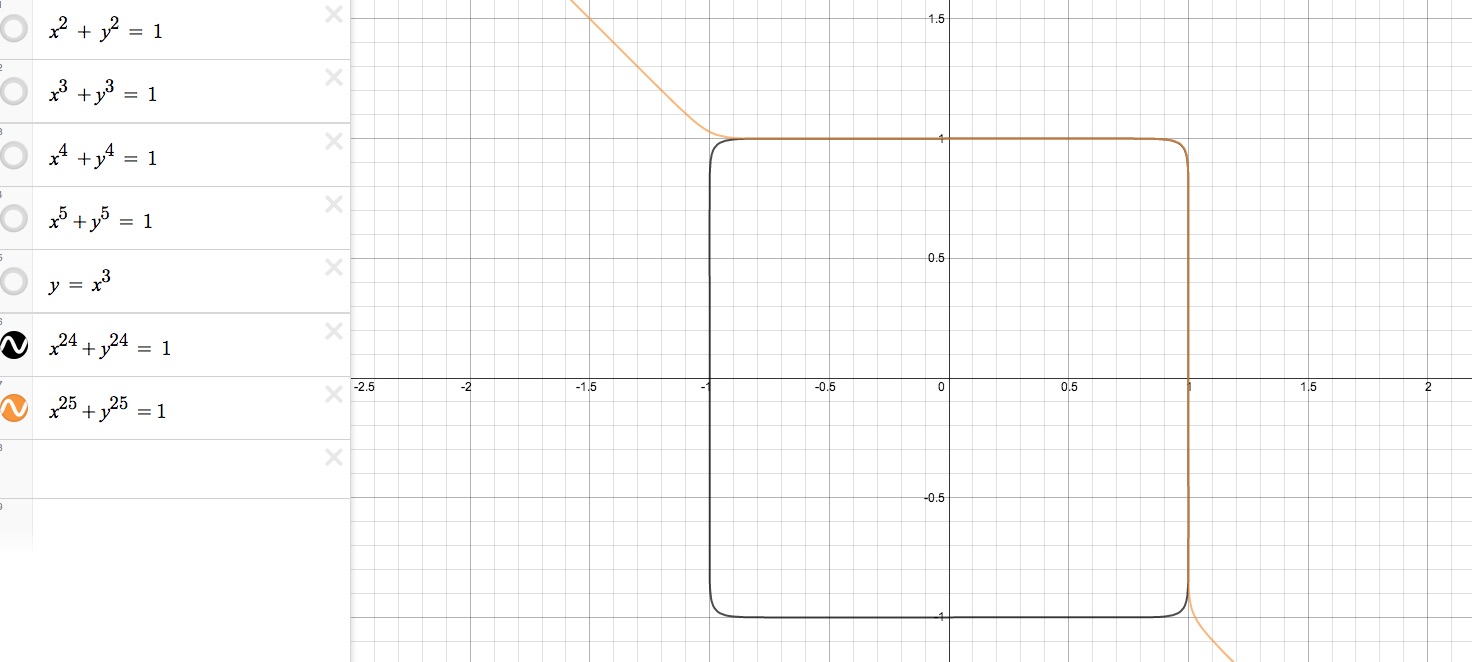
The first four graphs are all plotted on the same coordinate plane and color coded in the first image on the left. The first function, graphed in red, is the standard equation for a circle whose center is at the origin and has a radius of 1 unit. Now considering the functions x^3 + y^3 = 1and x^5 + y^5 = 1 in blue and purple, we see they are very similar. The tail ends of the purple function are a little steeper and therefore fall underneath the blue function, but the purple function's curve in the first quadrant is above the blue function's. We notice these are both functions in the odd degree. In thinking of the parent graph of a cubic function, y = x^3, shown in the second image on the right, we can see that these two graphs have somewhat similar curves, but they extend upwards and downwards to infinity and negative infinity in opposite directions. We also see the different in that the x and y intercepts of both the blue and purple functions are at 1, but the y = x^3 goes through the origin.
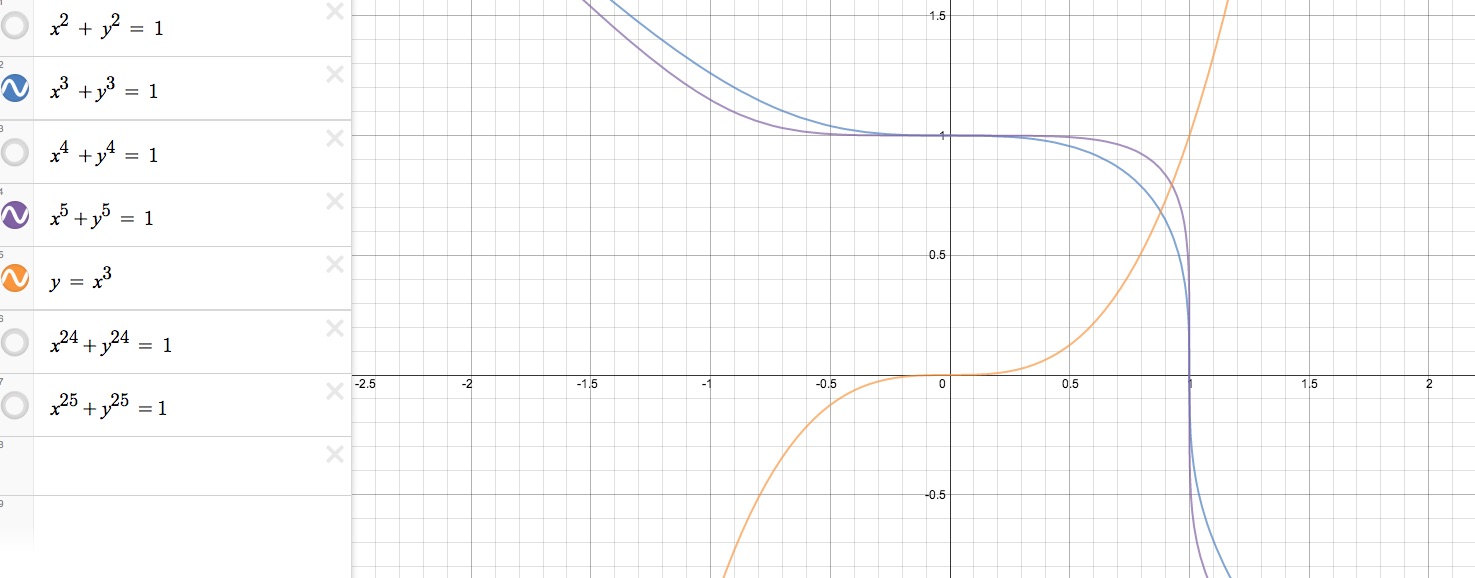
Now, let's go back and focus on the functions of even degree, x^2 + y^2 = 1 and x^4 + y^4 = 1. We said already that the first function is the standard equation for a circle, or better yet, the unit circle. The other function seen in green, appears to be a shape somewhere between that similar to a cirlce and a square. It touches the circle at four points which are respectively two x intercepts and two y intercepts. At x = 1 and x = -1 and at y = 1 and y = -1.
So going back to all 4 of these functions, they all intersect each other at the x intercept of 1 and the y intercept of 1. This makes sense because the function of all of the graphs are given as x and y raised to some power equal to 1. If we graph anymore functions similar to these, no matter what power x and y are raised to, we can expect the x and y intercepts to always be 1. The algebraic process to find intercepts is to plug in zero for x if you want to find teh y intercept and solve for y. Well generally speaking, x^n + y^n = 1 for any integer n, 0^n is always 0 and therefore you're left with x^n = 1 or y^n = 1 and to solve for x or y, any root of 1 is always 1. In fact, the x and y intecepts would still be 1 even if we were graphing a function x^a + y^b = 1 for any integers a and b. However, for this problem, we will stick to the general form x^n + y^n = 1 where x and y are both raised to the same power. When x^24 + y^24 = 1 and x^25 + y^25 = 1 are graphed, I expect that the first one of even degree will be some sort of closed polygon that touches the original unit circle in 4 places and has x and y intercepts at 1. The second function of odd degree will be an almost identical curve to the purple and blue ones, but will extend out a little further towards infinity in teh first quadrant than the purple curve. However, it will of course x and y intercepts of 1. Let's see what these graphs will look like:

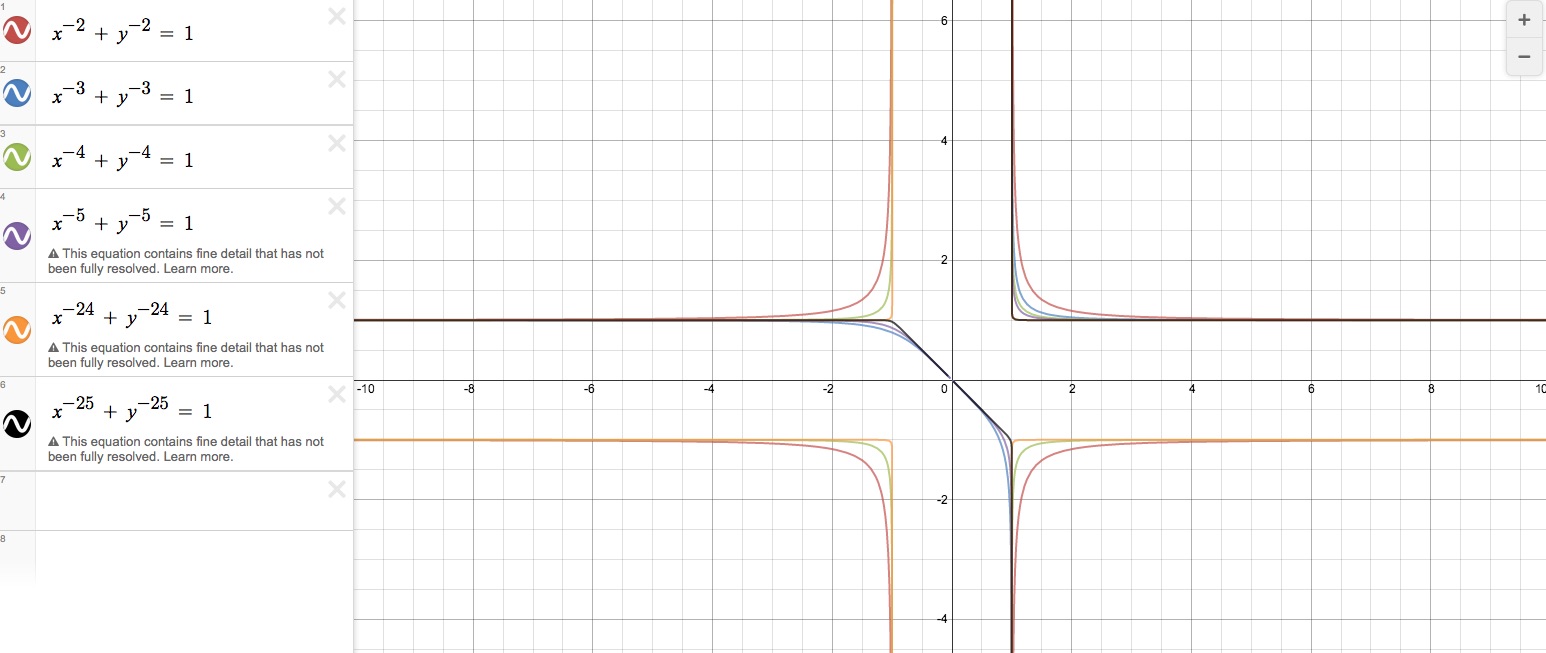
What if the exponents are negative?
As you see in the graph below, if the exponents are negative, it creates disjointed graphs rather than a continous graph as when the exponents were positive. There are still similarities in their curvatures and patterns though in comparison to the corresponding graphs with positive powers. The even and odd powers follow similar patterns to what we already investigated.
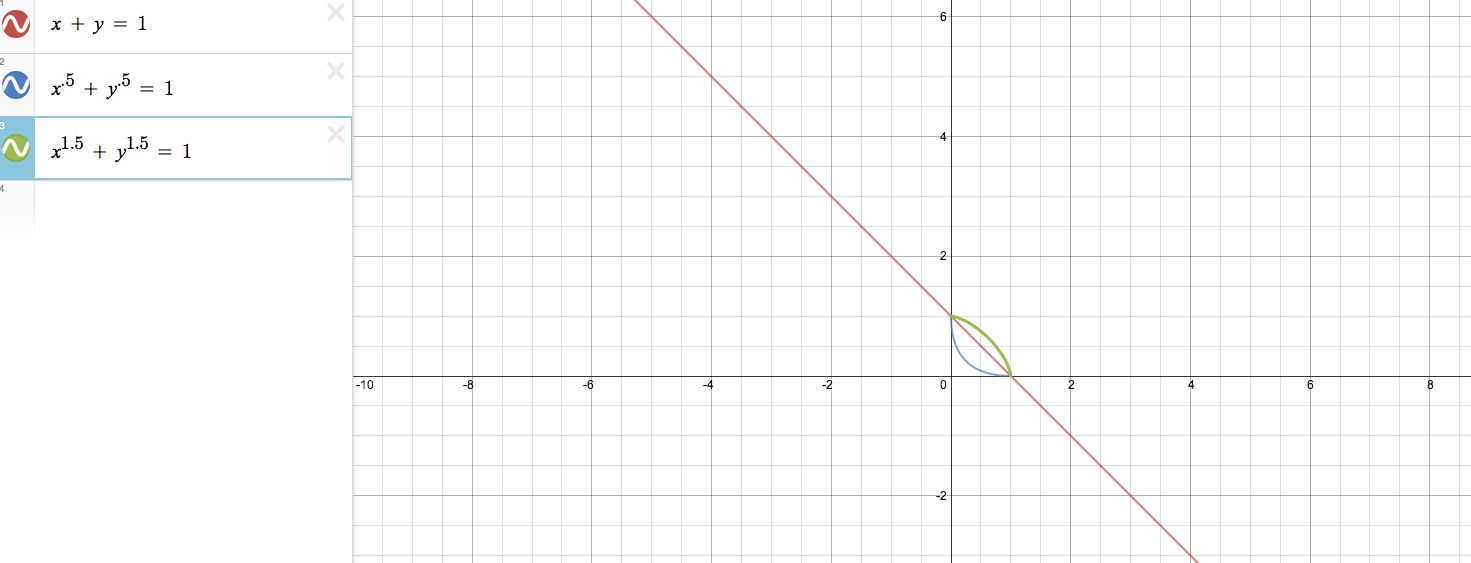
What about exponents between 0 and 2?
As you can see in the picture below, if the exponents are 1, meaning it looks as if there are no exponents in our function, then the graph becomes linear. It's a straight line with a negative slope whose x and y intercepts are 1. This should be easily predictable by taking our equation x + y = 1 and putting it into the standard form of a line y = mx + b so that we get y = -x + 1. From this equation we now know that b, our y intercept is 1, and m, our slope, is -1. Now the blue curve is what we get if the exponents are .5. This goes under the line we have just been discussing. This makes sense since those exponents are less than 1 and looking at the green curve, it is above that line because it's exponents were 1.5, which is greater than 1.
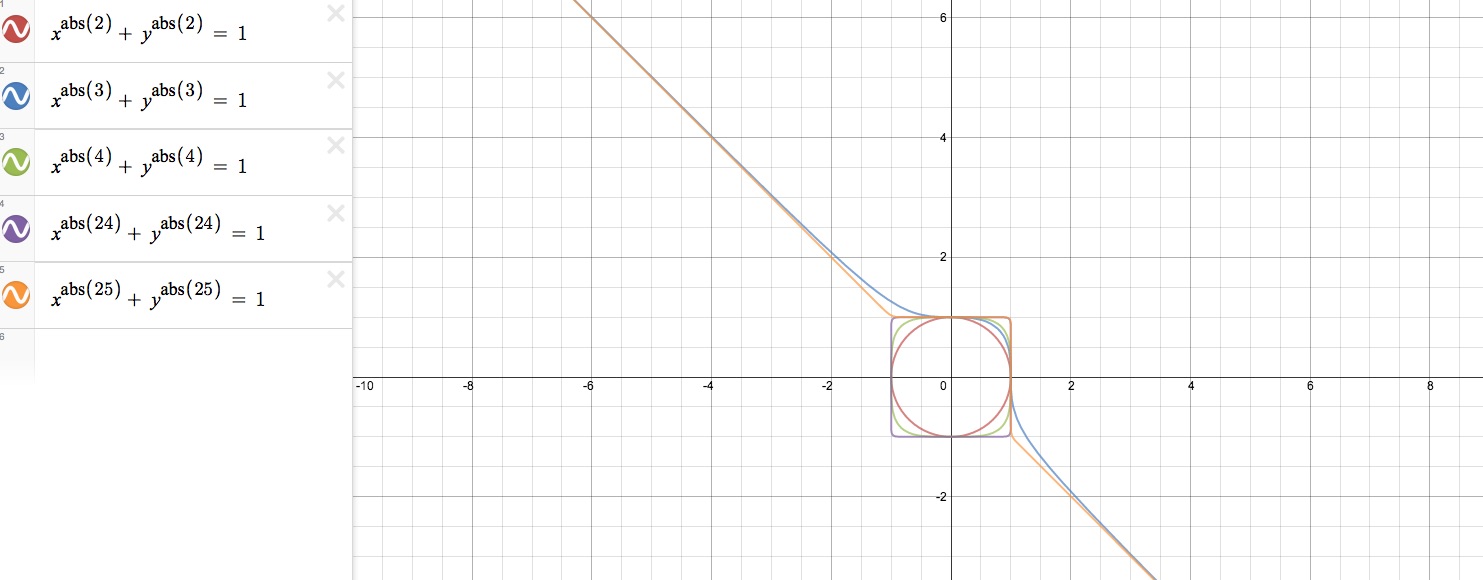
Graph the powers of the absolute values of x and y.
Is there anything that can be done with this investigation?
In regards to implementing this investigation into a classroom for students to explore, there is so much that can be done with it. For some students or classes, you may be able to leave it very open ended and simply give students the first function: x^2 + y^2 = 1 and tell them to change the exponents and see what they notice and compare graphs. It could be a little more guided like this one with still some openendedness to it. The investigation could also be a little more guided by including more scaffolding questions. If you didn't want students to spend a lot of time graphing a ton of different functions themselves, you could do it beforehand and have students write predictions about what these certain functions might look like before revealing them.
Return to Home Page