
Courrey J.
Alexander
Construct graphs for the parabola y=ax2+bx+c for
different values of a, b, and c. (a, b, c can be any rational numbers).
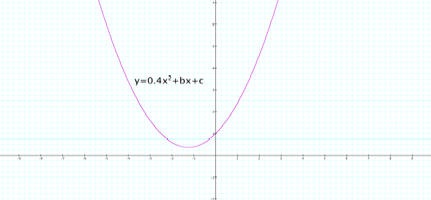
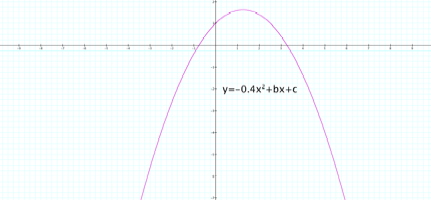
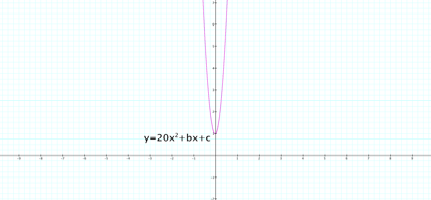
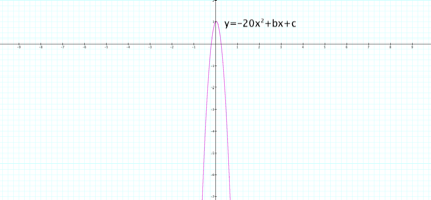
As the value of a increases while b and c are held constant, the
parabola closes inward. As the
value of a decreases while b and c are held constant, the parabola widens. For positive values of a, the graph
opens up, and for negative values the graph opens down. Of course, when a=0, the graph is no
longer quadratic. It becomes
linear.
Here are the graphs when a=0.4 a=-0.4 a=20 a=-20, respectively.
Click here to examine
the graph as a varies from -20 to 20.
It seems that as b varies while a and c are held constant, the
axis of symmetry of the graph of the parabola translates to the right (upward)
toward the y-axis as b approaches 0 from the left up to y=1. Conversely, the axis of symmetry
translates to the left (upward) toward the y-axis as b approaches 0 from the
right up to y=1. Axis
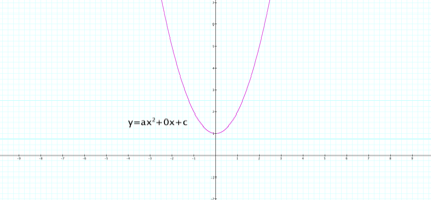
of symmetry is x=(-b)/2a. So, for
a and c held constant at 1 and b=0, we have x=0/2(1), i.e., x=0. If x=0, then ax2=0 and bx=0
while c=1. Therefore y=1 or
y=c. Here we have the axis of
symmetry at x=0 and y=1.
Click here to examine
the graph as b varies from -20 to 20.
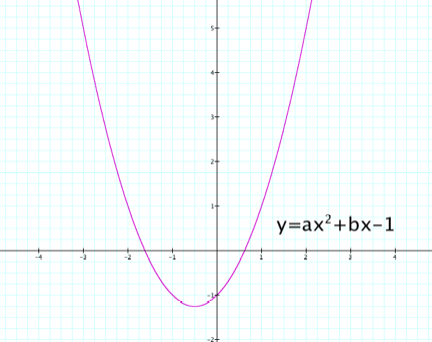
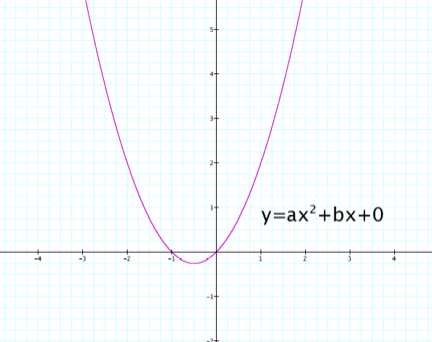
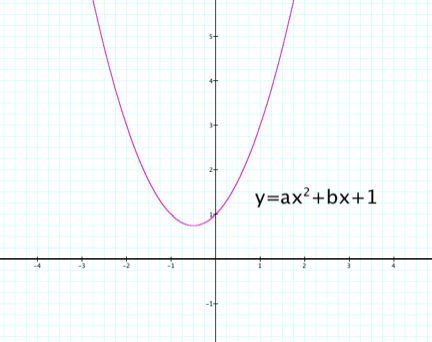
Investigating what happens when c varies as a and b remain
constant, we can observe the point where the graph of the parabola crosses the
y-axis.
Click here to examine
the graph as c varies from -20 to 20.
Now we will examine the graphs of the following:
1) Graph of the
parabola as a and b vary while c
remains constant,
2) Graph of the
parabola as b and c vary while a
remains constant,
3) Graph of the
parabola as a and c vary while b
remains constant,
4) Graph of the
parabola as a, b and c vary at the
same time.