What is a polar equation?
- A polar equation of a curve is usually expressed in polar coordinates and written with r as a function of theta. Polar equations may exhibit different forms of symmetry.
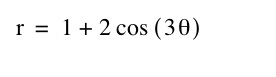
In this assignment we are going to look at the following equation:
and what happens when we change this equation with different values and functions. Here is how the previous polar equation looks on a graph.
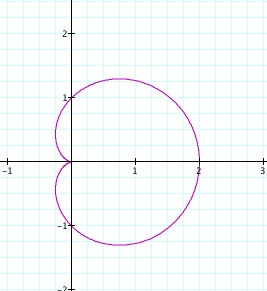
If we change the graph by addding coefficients it will form a number of leaves, which depends on the value of k. If a and b are equal, the graph will have exactly k leaves.
As you can see from the next graph as k is increased the number of leaves also will increase by that same amount. In this polar equation k=6 so six leaves are formed.
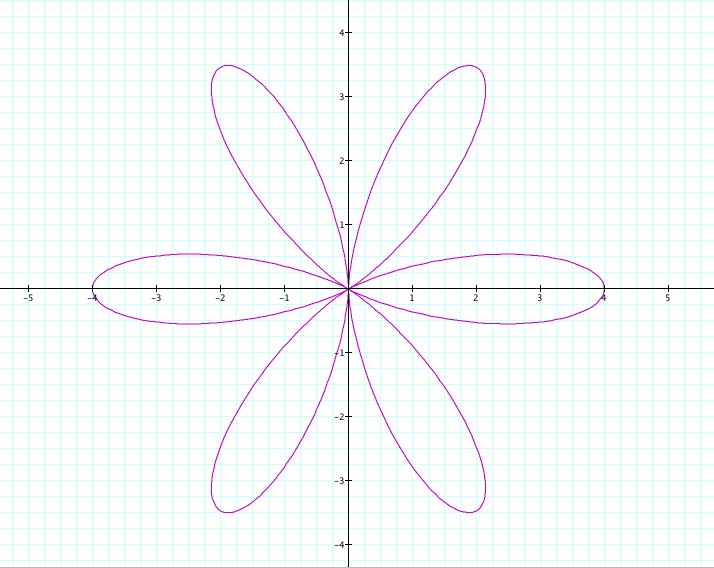
Click here to see this graph in motion as a and b are kept constant while k ranges from 0 to 10. New leaves are formed as k increases and decreases.
What happens when the constants change? In the previous examples I used 2 as the constant for both a and b. But what if these vary.
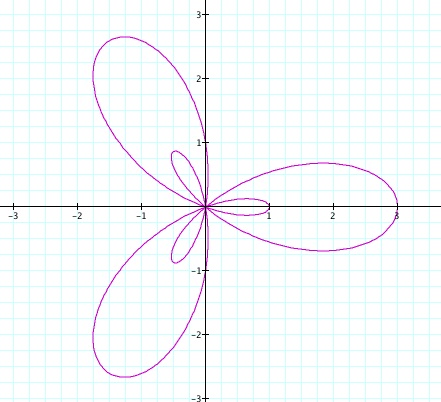
In this example a=1 and b=2 with the constant equal to 3. The values of a and b affect the size of these leaves. Also, these variables determine if there will be an extra set of leaves along with the original k leaves or not. The shape of the leaves and how close their vertices come to the origin depend on how much bigger a is than b or b is bigger than a. In this case b is larger than a so the larger graph is b and the smaller is a.
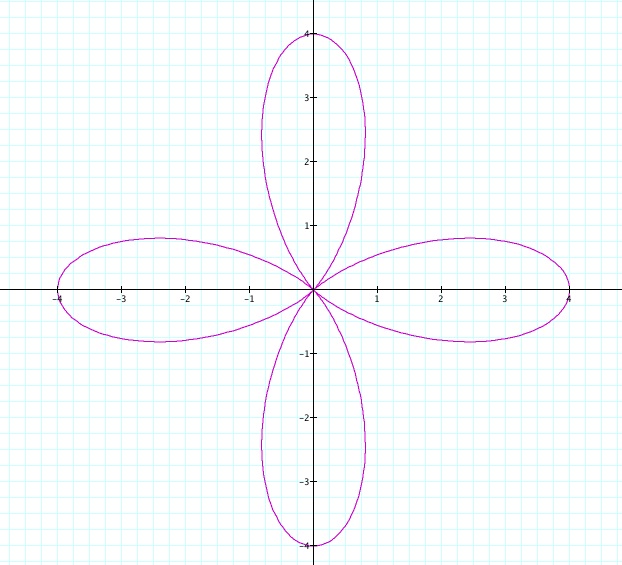
What happens if k is equal to an even number. In this case k is equal to 4.
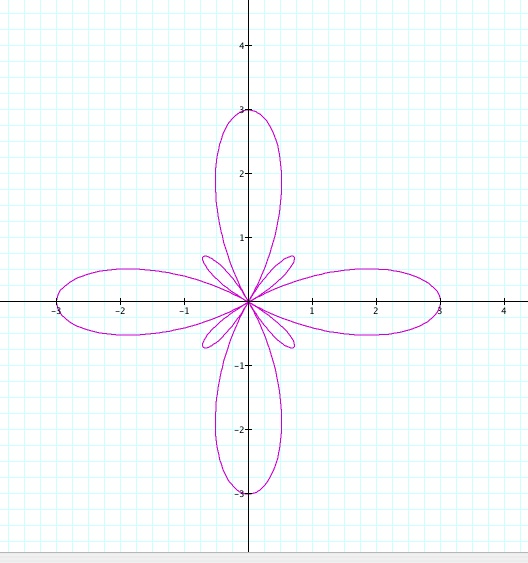
As you can see when k is even the second set of leaves forms between the larger ones. Every equation of this form will produce leaves with that have (a+b) as their maximum distance from the origin. The difference in the values for a and b will determine how much bigger one set of leaves is than the other.
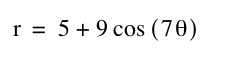
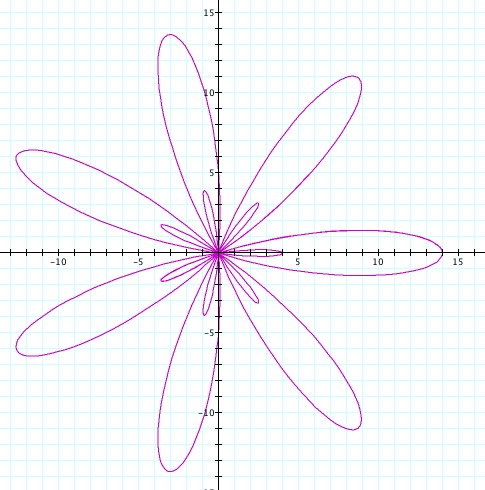
If a is less than b, a second smaller set of k leaves will be formed. When k is an odd integer, this second set of leaves will form inside of the others. For example, if a=5 and b=9 for a graph with 7 leaves (7=5), our graph will look like this:
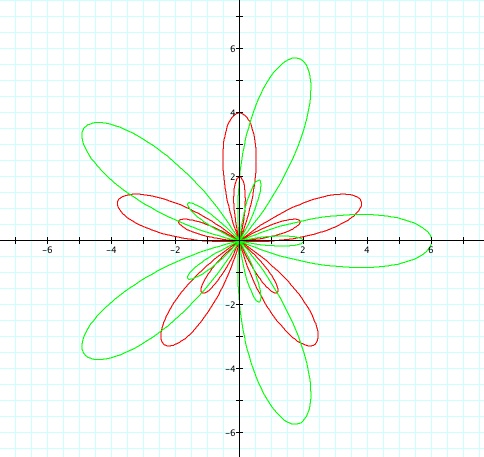
Let's take a look at these graphs if were to use sine instead of cosine. In this graph I used all odd numbers for a, b and k.
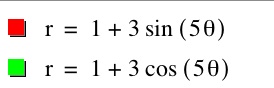
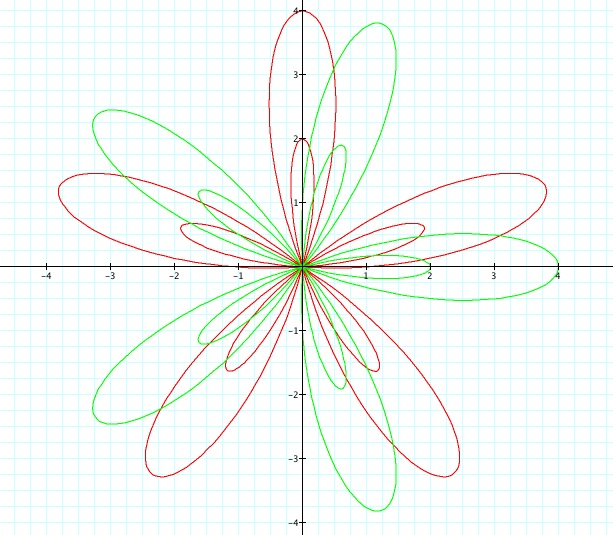
The sine graph (green) is just shifted to the right. If you were to make the a and b coefficients different in the two equations and keep the k value the same you can see that the cosine function just shows larger leaves than the sien function.