
# 12
STAMPS DATA
In this problem I developed an Excel file that showed a scatter plot for the cost of first class letter postage from 1933-1996. With the following data I developed a scatter plot. By using a scatter plot a visual picture is developed so that we can find an equation for the data. Here is the scatter data and the scatter plot:
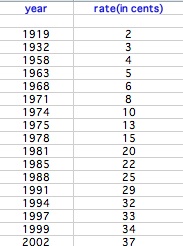
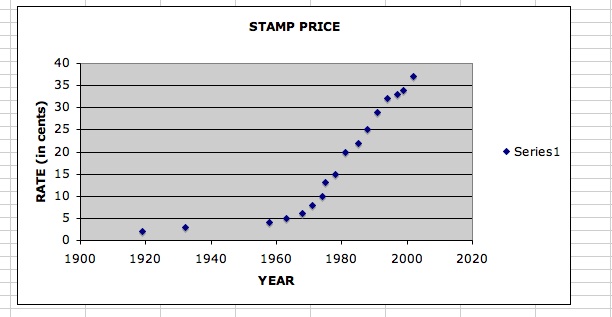
As you can see the cost of a stamp definitely increases. Now can we predict which type of function will give us a more accurate best-fitting line, a linear or exponential?
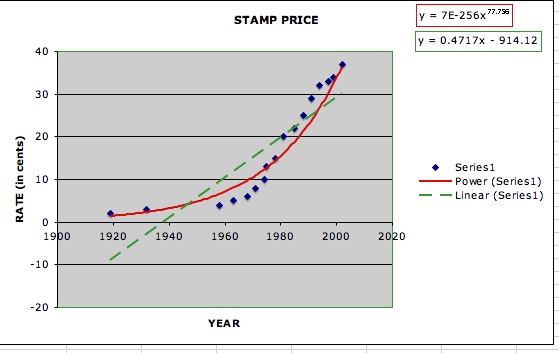
You can see the green line is a linear equation and the red line is a power or exponential line. The equations for this funstion is then developed from this data.
By plugging a number for x you can predict the cost of stamps in the future. For example the cost of a
stamp will reach $1.00 in 2150. The linear equation to find this would look like this:
100=.4717x-914.12.
Another example could be when the cost of a stamp reaches 64 cents. The equation would be
64=.4717x-914.12.
Solving you could find that the cost of a stamp will reach 64 cents in 2074.
To find when the next increase would occur you could predict this by saying in
40=.4717x-914.12.
Solving this equation you get the next 3 cent increase in approximately 2023.