
Carrie Dillman
An Investigation of the Graph of y=Asin(Bx+C)
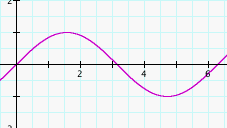
Understanding the the dynamic aspects of the sine function will help in interpreting and gathering information from the graph. The domain of the sine function is the set of all real numbers. The range of the sine function is the closed interval [1,-1]. The sine graph is a periodic graph. A periodic graph shows a pattern that repeats over a consistent interval. One complete cycle or period of the sine curve begins at the origin and ends at 2pi. The sine curve also has a measureable aspect called the amplitude that corresponds to the range or y-values of the graph. The amplitude is the height of the curve. Therefore the range of the sine curve tells us that the amplitude is 1. As we will see, the sine function, just like any other function, can also be translated or shifted to the left or right.
Consider altering the period and amplitude of the sine function and what affect the alteration has on the shape of the graph. First, think about whether or not there are any coefficients in the function y=sin(x) and if so what they may be. Hopefully, you recognized that the coefficient is 1. Customarily we do not write a 1 when a variable or function is multiplied by 1,or zero for that matter, therefore, y=sin(x) is actually y=1sin(1x+0). Let's assign each coefficient a variable so we can talk generally about the role of each. We'll use A, B, and C, letting A=1, B=1, and C=0.
To begin this investigation, let's see how each value A, B, and C affect the graph separately. We'll start with A keeping B and C constant where the value of B will remain 1, and the value of C will remain 0. We will explore the graph when B=0 later in the investigation. At this juncture, it is best for B to have the value 1.
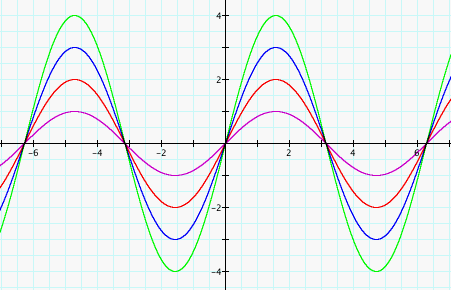
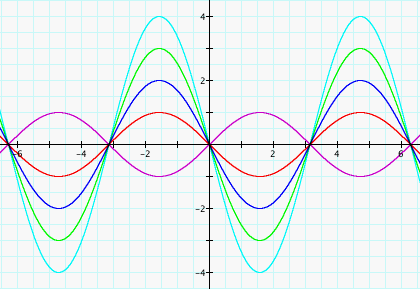
The graph on the left shows four graphs of the function y=Asin(x), with A=1, 2, 3, and 4. The graph to the right shows graphs of the same function. Can you tell what the values of A are this time? How can we describe the affect A has on this function and its graph? First, let's think about what the function y=sin(x) is saying. It says that when we take any x in our domain of the real numbers, we are going to get a y-value somewhere in between the interval [1,-1], also known as the range. So multiplying the whole function by A is going to result in a y-coordinate or value that is A times larger. Therefore, when we choose A=2, for example, we are multiplying the value of y, or the y-coordinate, by 2. Since the only possible y-coordinates for the function y=sin(x) lie between 1 and -1 on the y-axis, we can think of it as a times the range, A[1, -1]. In terms of the graph on the left, the purple curve shows the graph of 1sin(x), or 1[1,-1]. Whereas the green curve is the graph of 4sin(x), or 4[1,-1]. We can conclude that the value of a controls the maximum height or range of the curve thereby affecting the amplitude. By the way, did you figure out that the values of A in the graph on the right are negative?
Now let's find out what affect the coefficient B, in the function y=Asin(Bx), has on the fuction and resulting graph. Again, we'll need constants so we'll keep A constant at 1 and C at 0 and see what happens as we change the value of B.
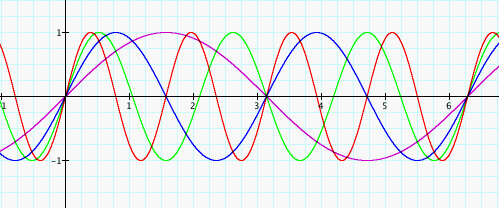
Whoa, what a mess! It's difficult to decipher exactly what is going on in the graph above. Let's see if comparing the graphs of each value separately won't help us see the change a little more clearly.
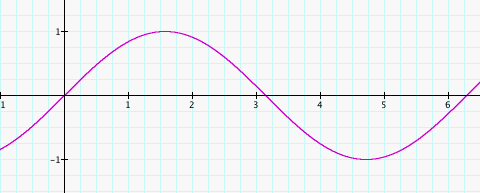
sin(x)
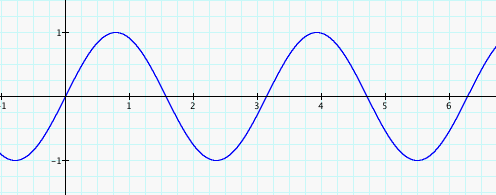
sin(2x)
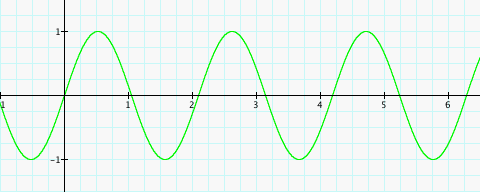
sin(3x)
sin(4x)
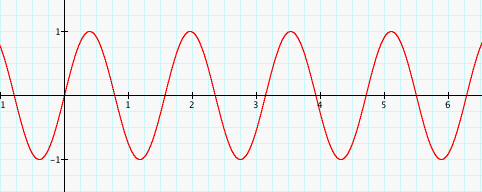
Ahhh. Much better. It would probably be best to determine what each graph above has in common first. Clearly, the amplitude of each curve is 1 and that is logical because we kept A=1. Next, each curve begins at the origin. Take notice, however, to the number of complete sine curves shown on each graph in between the interval of 0 and approximately 6.25 on the x-axis. The graph of the function y=sin(x), where B=1, shows one complete curve between 0 and approximately 6.25. On the other hand, the graph of the function y=sin(4x), where B=4, shows 4 complete curves between 0 and approximately 6.25. The same is true for the two remaining graphs. It seems the value of B corresponds to the number of cycles completed, or the number of times the curve repeats, within the interval on the x-axis that it takes sin(x) to complete one curve cycle.
Is it possible for the curve not to complete a cycle within the interval 0 and approximately 6.25? Sure! Can you suspect what types of values might cause that to happen? Let's try a couple.
sin(x)
sin(1/2x)
sin(1/4x)
sin(1/8x)
sin(1/16x)
sin(1/32x)
sin(1/64x)
sin(1/100x)

For any value of B within the interval [0, 1), the graph begins to form a straight line. This makes sense when yo uthink in terms of the unit circle. Sin(0x)=sin(0), which on the unit circle is the x-axis.
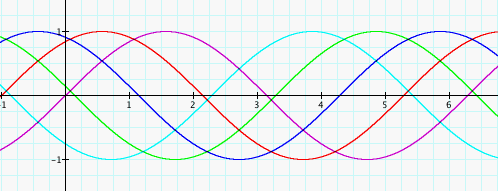
Finally, we come to the value of C, which is not a coefficient since there is no variable, but still an aspect of any function, including y=sin(x), worth examining. This time we will keep A and B constant at 1while we look at different values of C.
sin(x+0)
sin (x+1) and sin(x-1)
sin(x+2)
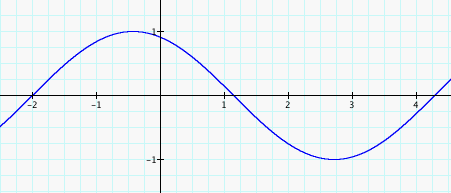
sin(x+3)
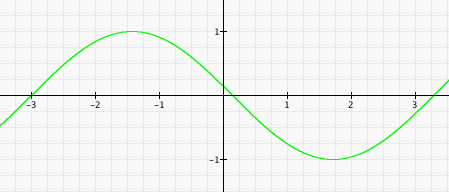
sin(x+4)
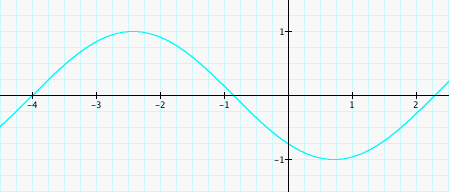
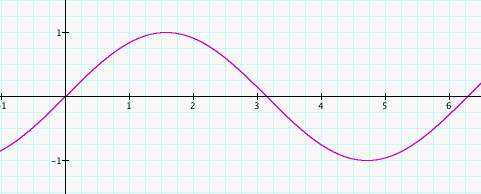
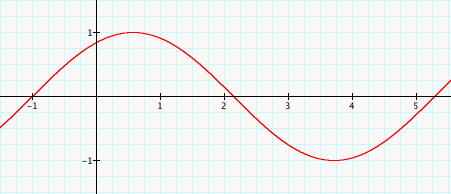
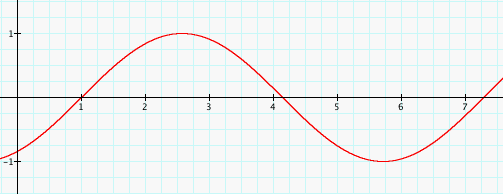
Altering the value of C does not affect the shape of the curve. Instead, C translates or shifts the graph. Look at the graph of sin(x) where C=0. The curve begins at 0. Now look at the graphs for sin(x+1) and sin(x-1). Assigning the value +1 to C shifts the graph to the left or negative side of the x-axis, while assigning the value -1 to C shifts the graph to the right or postive side of the x-axis, thereby changing the origin of the curve. Notice the pattern follows when C=2, 3, and 4, except when C=2, the curve originates at -2 not -1 and so on.
Now that we have seen how varying these values separately affects the graph, questions remain about the affect of altering two or maybe even all three of the values of A, B, and C at a time.