
Stephani Eckelkamp
Looking at Exponential Value
Differences
The
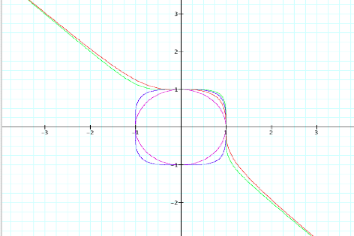
following graphs were produced using Graphing Calculator 3.5.
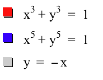
Question:
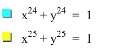
Using the
above information what do you expect the graphs of x24 + y24
= 1 and x25 + y25 = 1 will produce?
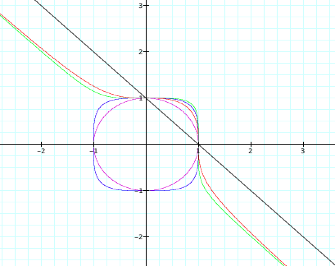
First of all
let us look at the graphs above.
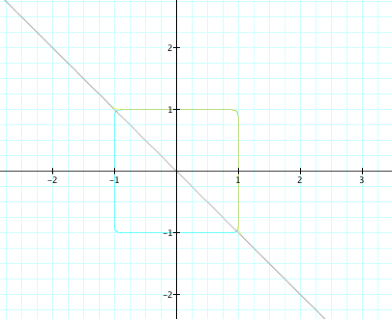
The graph of x + y = 1 produces the unit circle (circle with center at
(0,0) and radius of 1). If we look
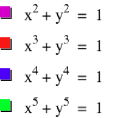
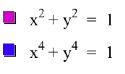
at the next graph with even exponents we see a graph similar to the unit circle
but more square (or perhaps a squared shape with rounded edges).
The grey line graphed above is the line y = -x. As we can see these graphs are asymptotic to the line y =
-x.
From the
graphs of the equations with even exponents we can deduce that the graph of x24
+ y24 = 1 will have a more squared off curve that approaches the
point (1,1) and is still asymptotic to the line y = -x.
The dark grey
line, x + y = 1, creates a line with an x intercept of 1 and a y intercept of
1. We can also write this line as
y = -x +1. This line shows were
all of the above graphs cross the x and y axis. As well as all of these equations passing through the same
two points, this is the most basic form of all of the variations of the above
listed equations. All we have done
to alter them is to remove the exponent, in which we see the line x + y = 1
produced.
Let’s
investigate further…
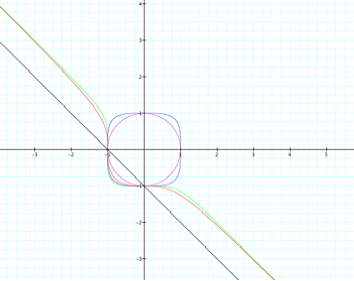 Suppose we
look at the same graphs as above, but with negative x and y values.
Suppose we
look at the same graphs as above, but with negative x and y values.
All four of
these graphs cross the x and y axis at -1.
-x3 – y3
= 1
-x5 – y5
= 1
-x – y = 1
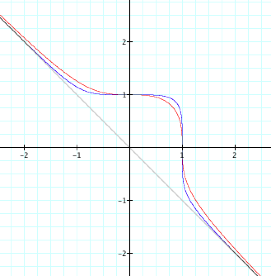
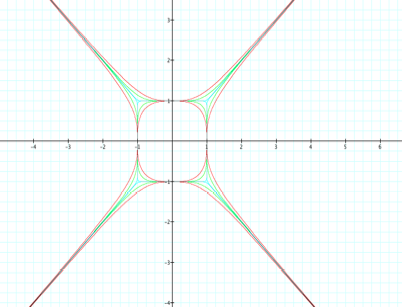
Now let us look at the
graphs of the equations with odd exponents, both positive and negative, on the
same graph.
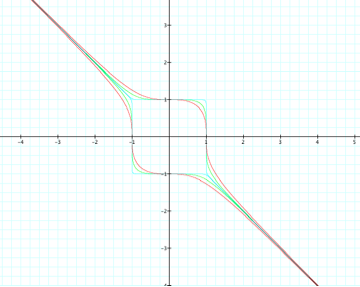
As we can see from this
graph, all of these equations are asymptotic to the line y = -x. The more that we increase the exponent (and
keep it odd) the closer our graph will come to the point (1,1) in quadrant I,
and (-1, -1) in the quadrant III.
If we change one
variable to a negative the equations produce this graph.
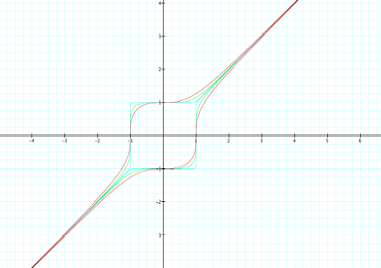
Now all of the odd
exponential equations on the same graph.
Suppose we plug in a
variable for the exponents. Click
on this link to see an animated picture.