
Stephani Eckelkamp
“Every Rose has
its Thorns…”
An Exploration of
Polar Equations
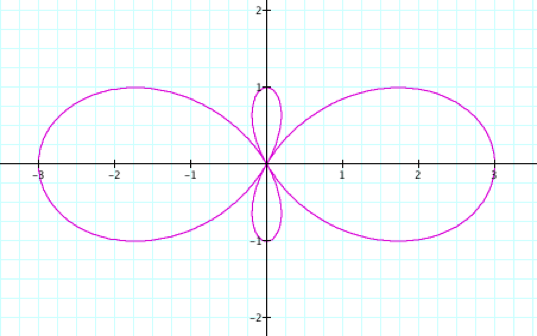
Investigation the polar
equation
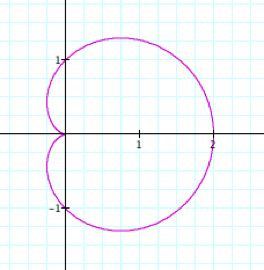
When a, b, and k = 1 When
B and K = 1
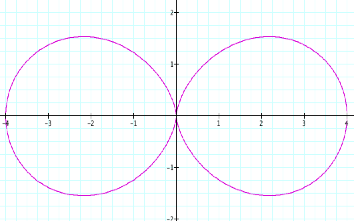
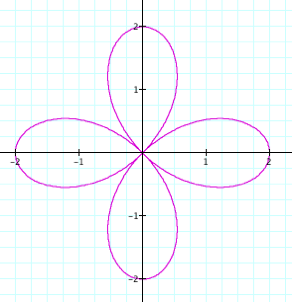
When a, b, and K =2 When
b and K = 2
What changes between the
graphs when 1 is replaced by 2?
|
F
The x
intercept to the right increases by 2, and the x intercept to the left
increases by 4, in relation to the origin. F
The range
does not change F
Creates a Two
leaf rose |
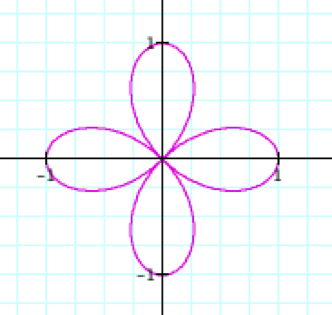
F
The x
intercept increase 1 to the right, 2 to the left and 2 along the y axis in
relation to the origin. F
The Range and
the domain are equal F
Creates a 4
leaf rose |
Further exploration of ![]()
What if a=1 and b and k=2?
From the above graph it
seems that a effects the range of the graph. What might the graph look like if we set a and B = 2 and k =
1?
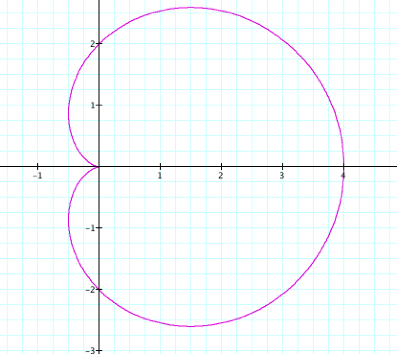
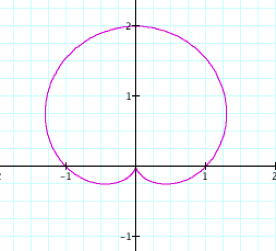
Here we don’t have a range
of 2, but we do see that the graph intersects the y axis at 2 and -2. When we change the k value from 2 to 1
the graph does not intersect itself like when k = 2.
Can you make a conjecture
for how the graph might behave for k = 3?
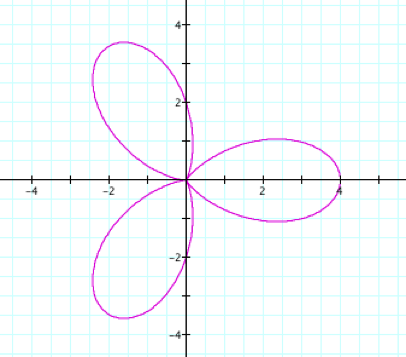
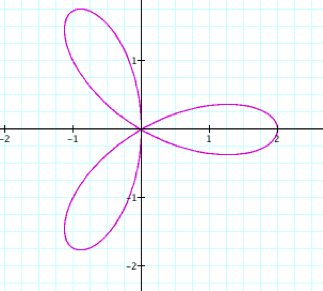
When we increase our k value
the graph intersects itself and forms 3 “petals.” This is called a 3 leaf rose.
Make a conjecture about K=4
and graph your prediction here
Now let us look at how the
variables b and k affect the graph of ![]() .
.
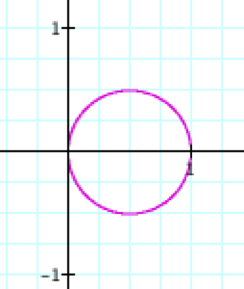
B = 1 and k = 2
All of our axis are crossed
at 1 and -1, which is our b value.
Let’s look at the graph when b = 2 and k = 3 to see if we can get a
better idea of how k effects this equation.
Here we have a 3 leaf rose
with petals that are 2 units away from the origin.
To further explore how k
effects the graph open this document and change
the k values.
What happens when K is even?
What happens when K is odd?
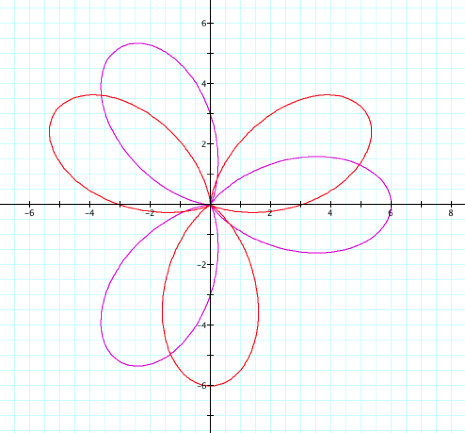
What if we replace cos with
sin?
Our new equation is ![]()
A, b, and k = 1
What is the difference
between the cos and sin
graphs with a, b, and k=1?
What
changed between the two graphs?
How can we explain these changes? Let us look at a few more graphs to see if we can generalize
the differences between the sin and cos graphs with the same a, b, and k
values.
A, b, and k = 2
Is there a difference
between this graph and the previous graph?
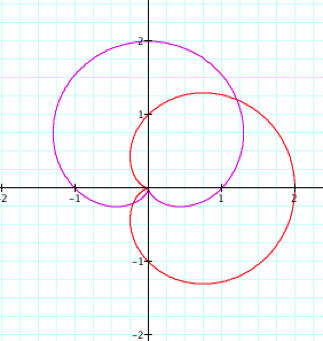
If we look at the difference
between when all variables are equal to 1 we can see a 90 degree rotation
clockwise from cos to sin.
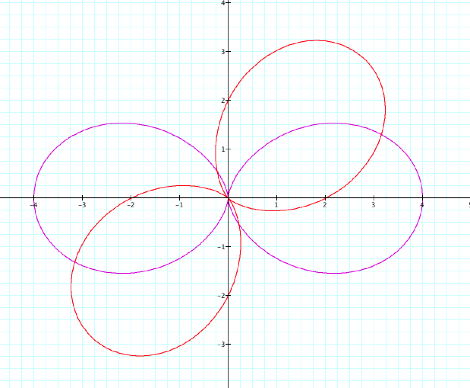
When looking at the graph
where all the variables equal 2 we can see a 45 degree rotation counter
clockwise from our cos to sin graph.
Let us look at what happens
when 3 is set for all variables a, b, and k.
Here we can still see that
the sin graph has been created by rotating the cos graph. Is it still 45 degrees? Look closely? Is there a way to check
your prediction?
YE!!! If it is rotated 45 degrees the maximum
distance from the center to a pedal should fall on the line y=x.
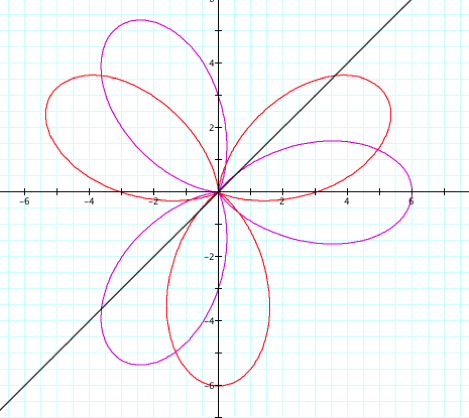
as we can see from the graph
above it is not a 45 degree rotation.
Do you have any guesses as to what it may be?
We can make a guess that
since two petals gave us a 45 degree rotation from cos to sin, perhaps 3 leaves
will give us 30 degrees?
How did we go from 45
degrees to 30 degrees?
Here is an example of a 3 leaf
rose in GSP with the angles of rotation marked
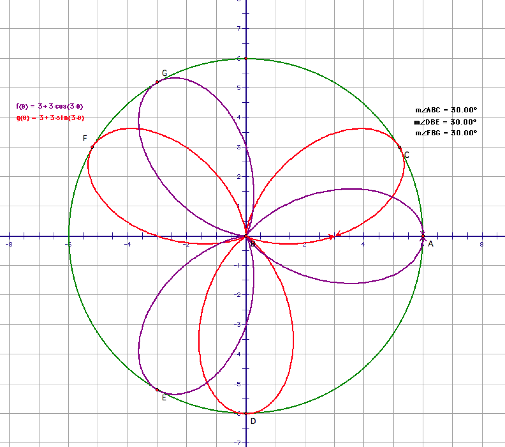
click here
to go to open this file
Can you create a GSP file to
give an example of the degree of rotation for another n leaf rose?
Create your picture here
(make sure you graph your
function as a polar equation)
return