
Assignment #5
Parametric Equations
By: Damarrio C. Holloway
A parametric curve in the plane is a pair of functions x
= f(t)
y = g(t)
where the two continuous functions define ordered pairs (x,y). These
two functions are called the parametric equations of the curve that they
form. The degree of the curve will
depend on the range of t, in
which in this exploration, we will denote t as the angle of rotation that some line makes from
an initial location. The functions
of x and y will vary with this time t.
Let us explore the different variations of graphs using the
base equation of a cycloid:
x = (a + cos(3t) cos(t)
y = (a + cos(3t) sin (t). In the following graphs we will first set numbers for a and we will vary t to explore the angles of rotation.
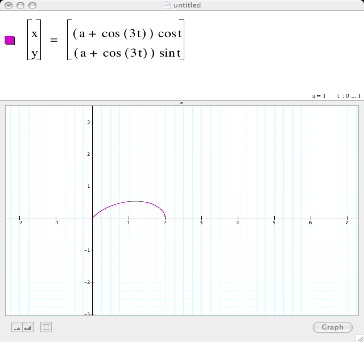
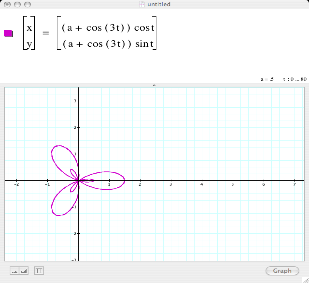
In this initial graph, we have the base equation of our cycloid with a=1 and the rotation of our graph varies over t ranging from 0…..1. In this graph, we have one curve, or as we will see later, we will have half a flower leaf.
Let’s explore different ranges of t shall we.
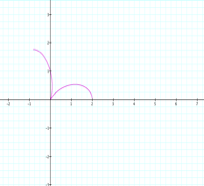
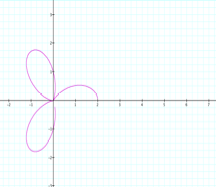
Figure 2 Figure
3
Figure 2 shows the range of t: 0….2, while Figure 3 shows the range t: 0….5.
In these images, we see that the set range for t determines the number of curves the figure will
make.
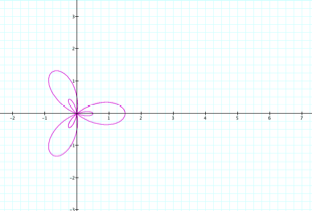
A complete look at the rotation:
 yields a three leaf rose.
Let us now explore variations of a in our equation.
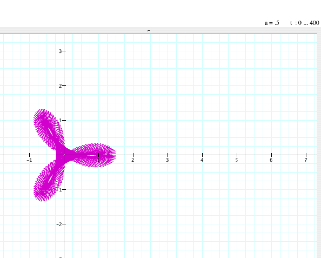
 This
figure displays the rotations when a=0.5 and t has rotations ranging from
0….8. We see that it has two sets
of complete rotations when a = 0.5.
This
figure displays the rotations when a=0.5 and t has rotations ranging from
0….8. We see that it has two sets
of complete rotations when a = 0.5.
As the range of t is increased by a multiple of 10, the rotations of the graph increase, giving the graph a bold look.
 Even
with a multiplication of 5 from the previous graph, the rotation of the curve
has a drastic increase.
Even
with a multiplication of 5 from the previous graph, the rotation of the curve
has a drastic increase.
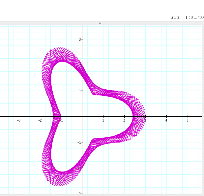
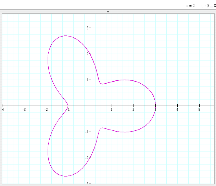
Figure 5 Figure
6
When a = 2, we have a quite different graph. The rotation of the graph does not go
through the origin as did the original graphs.
We have seen what varying a and t will do to the
graph, now let’s take a quick look at a change in “leaves.”
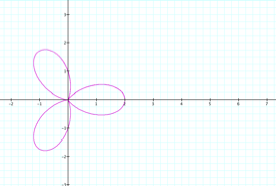
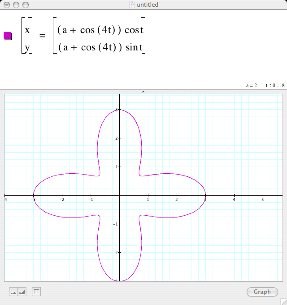 Figure 7
In Figure 7, we now have a 4 leaf rose because of the increase from 3 to 4 for the ‘t’ coefficient.
 or even
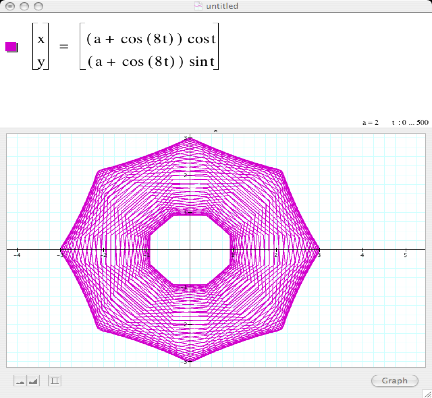
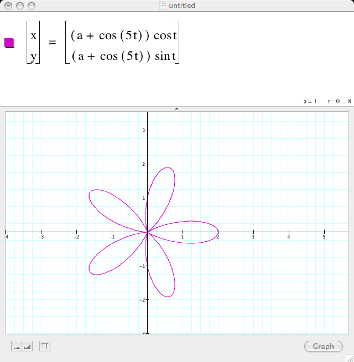
Figure
8
Figure 8 yields a 5 leaf rose with the increase of 1 from
figure 4. The rose rotates through
the origin because a = 1 as in the original equation. The shapes and curves for this particular parametric
equation are endless. As you can
see, the higher you set your t-values, the more rotations you can create. Also, with more rotations and any
increase in you’re a-values, the closer your graph reaches the origin.
Return